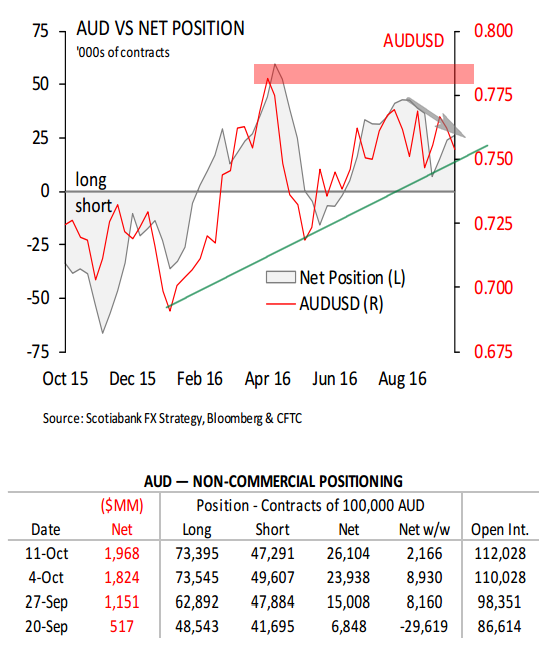
AUD positioning looks very interesting, a possible divergence is forming. Since making that high in long positions in April, AUD was not able to reach it again. The current hesitation signals a potential long term reversal. Let’s tak a look at the chart.
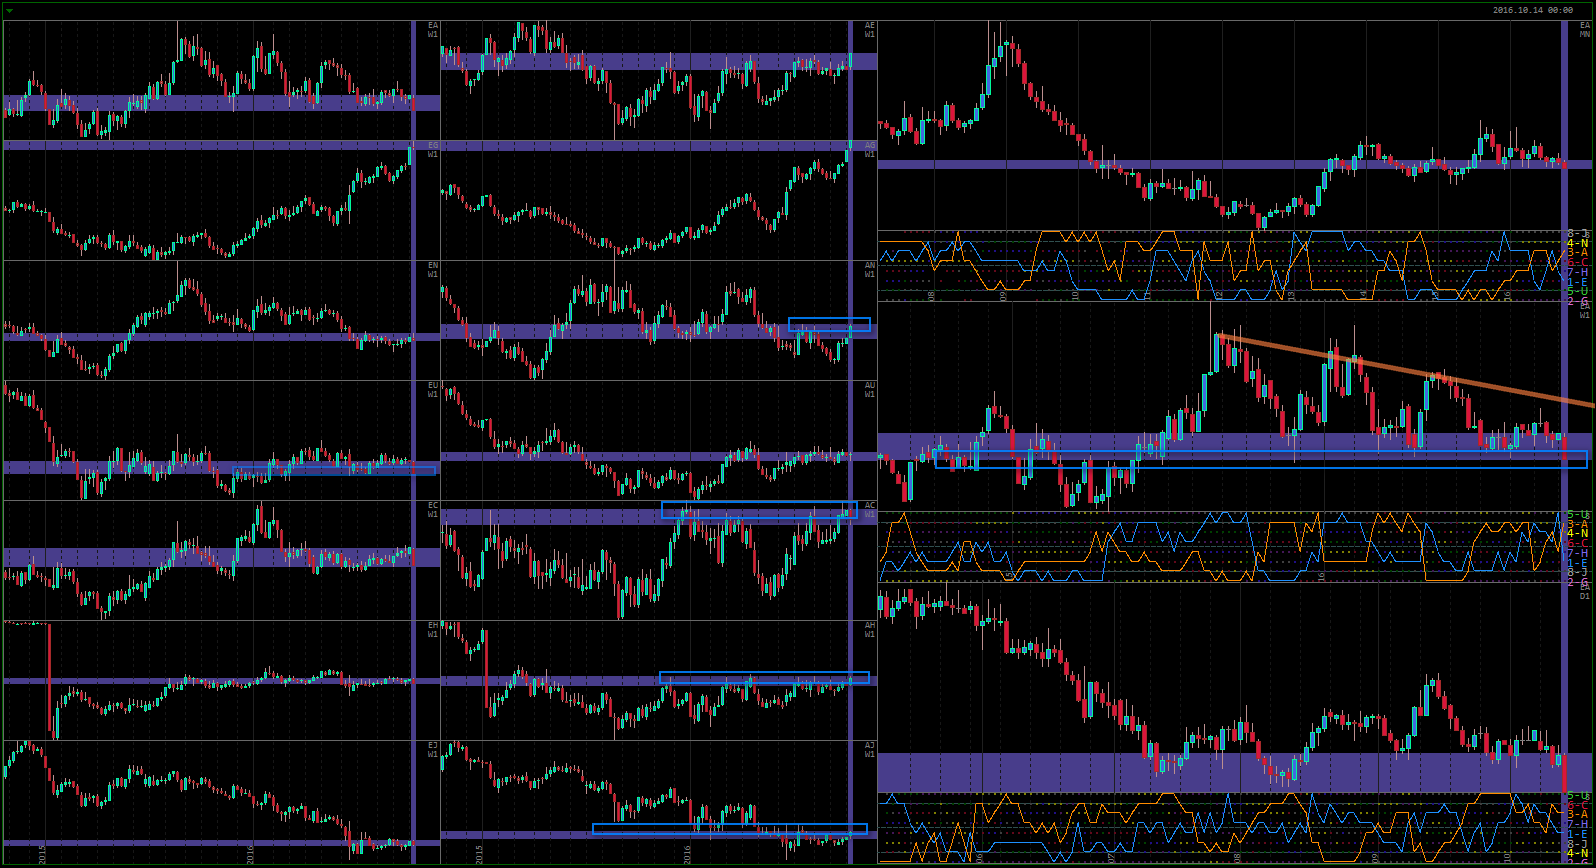
I’ve chosen EA rather arbitrarily, because the other currency really does not matter that much. However, AUD is trading at a very interesting price right now. Not significant resistance that it is facing in pretty much ALL trading pairs. In AG, even though it is not visible on these Weekly charts, the price is reaching a narrow range in which the pair has been trading between early 2011 and early 2014. From technical point of view, the chances for AUD to continue rising are relatively subdued.
Note that on Monthly strength index chart only NZD and JPY are higher then AUD at the moment. What is interesting about AUD is that even though it has a bullish cycle and relative strength (it is actually second bullish currency in the last 6 weeks), it failed to print strong bullish price action. Other than AG (due to Brexit related concerns in GBP) and AN (due to recent decline in NZD), AUD could hardly move higher to any currency.
EUR, having closed the week with strong bearish sentiment, is taking EA into that very strong support area that we have already looked at. If price is rejected from here, selling AUD will become irresistable. However, if the coming bearish cycle will be as strong as I expect it to be, there should be no problem finding an entry anywhere during the next couple weeks.
Let’s take a look at the Oil, knowing that it must either stagnate or decline to support bearish analysis in AUD.
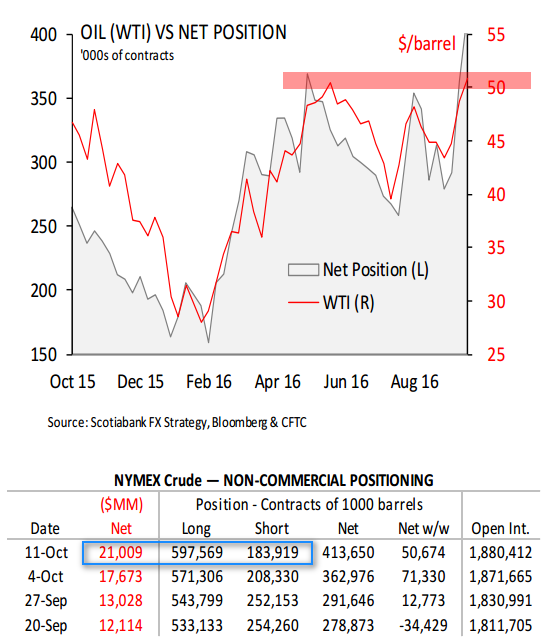
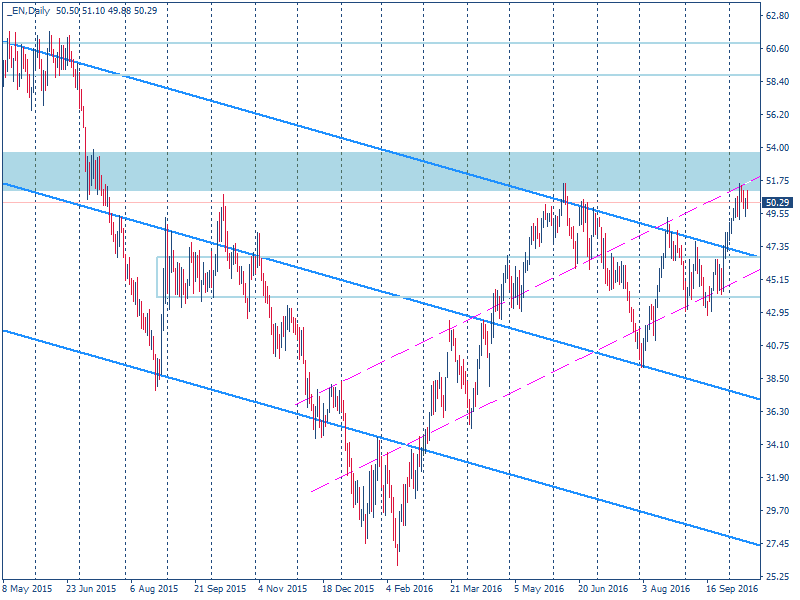
Indeed, both Oil COT and the chart itself look VERY interesting.
COT is showing a great increase in bullish sentiment this week, with 25K contracts covered on the short side and 26K added on the long side. At the same time, the price are facing a very strong resistance area and psychological level of $50. Of course, big traders might know something we don’t that would justify their buying, but it could also be the needed stop run to take Oil lower. If all these traders will be wrong in their bets, the next bearish wave will be very significant.
What will happen that will take Oil above $50 right now? Next strong resistance is in the area of $60, but first we need to take out the current level. The price is hesitating doing so for the last 9 days. I myself would never buy here, even on the initial breakout (if it happens).
Together with the above AUD analysis, something interesting is certainly building up. My bias is most certainly short, BUT if I am wrong here, the upper break on both AUD and Oil must be great and led by some fundamental events that Market is anticipating.
Let’s take a look at another interesting currency that has been on my radar for months now, and yet consistently refused to reverse: JPY.
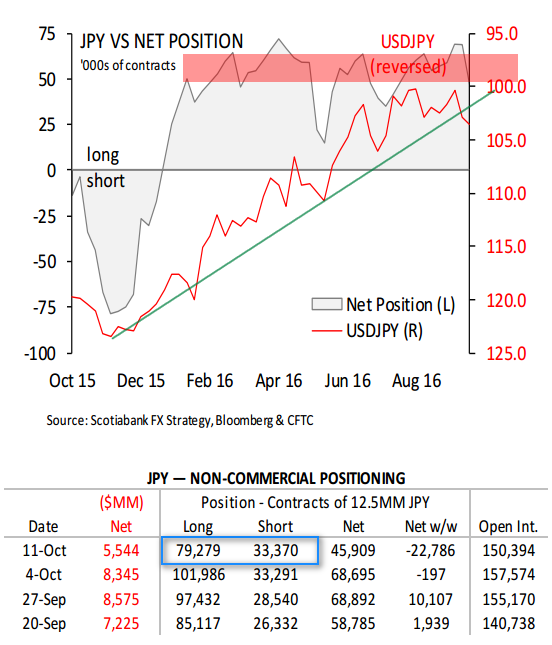
Speculators are hesitating to buy above the current level at which positions are kept for almost a year already. They have tried selling in June, but the Market quickly proved them wrong. However, I cannot see how this enormous bullish cycle (as seen on the picture below) can continue without a significant correction. This week we can see that 22K contracts has been closed on the Long side, with the Short side remaining virtually the same. It is understandable to take a profit at these levels, but what about actually selling JPY?
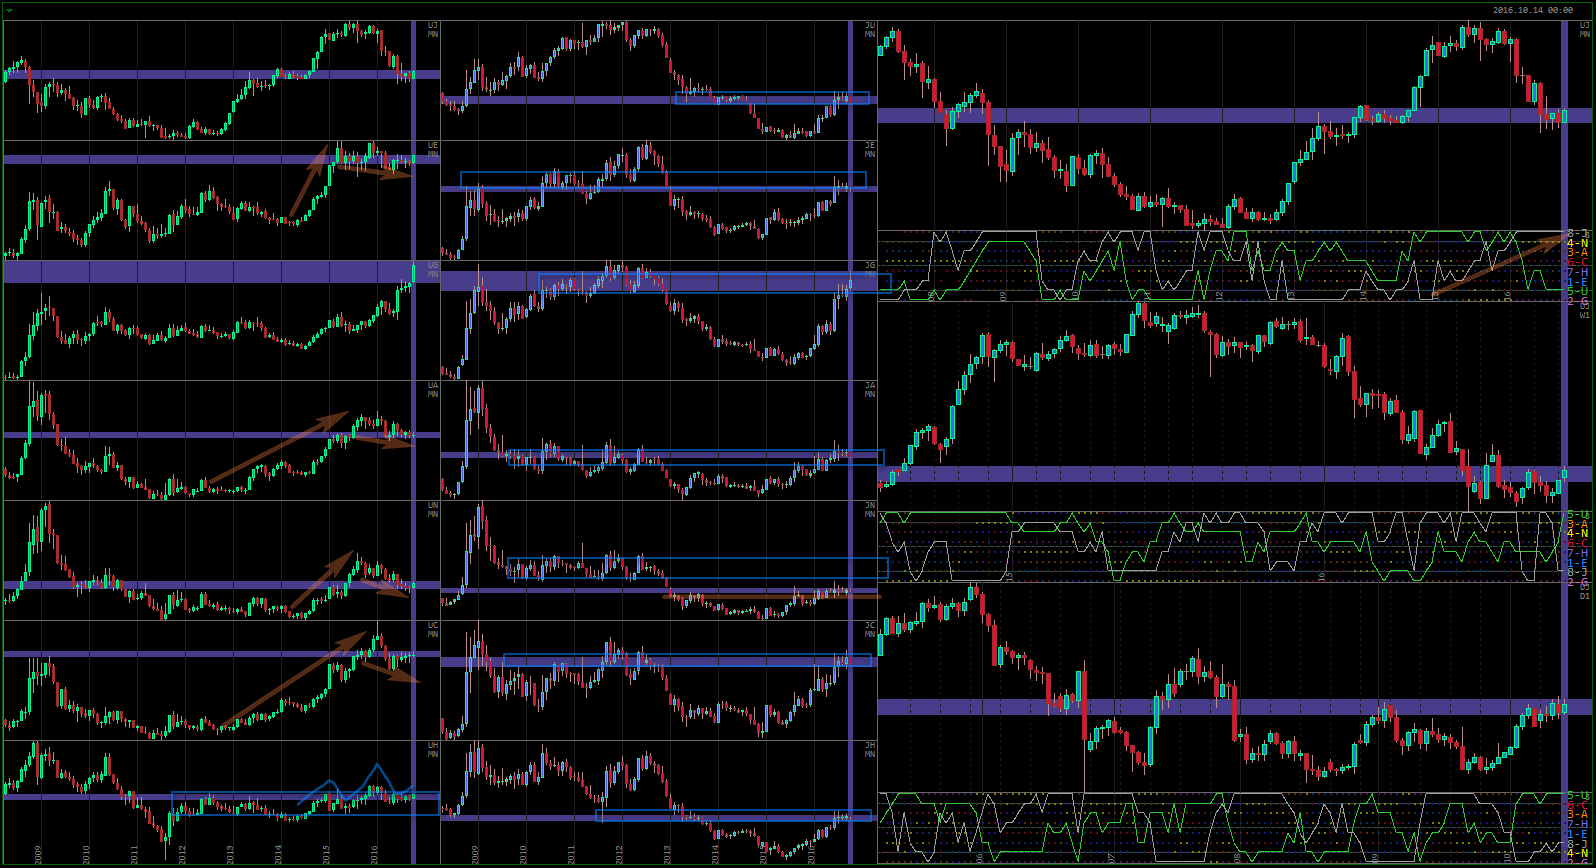
The Monthly chart clearly shows the scale of the current bullish scale. It’s refusal to reverse easily is only understandable – the momentum is just too great. However, I cannot help but notice that JPY is facing some very strong resistance at the current levels or a little bit above. Virtually every pair is either already trading in a huge Monthly value zone (JU, JG, JA), or facing it (all other pairs).
Once again, because we are looking at the Monthly chart, this reversal might take still a long time to fully develop, but we’d better watch out.
Interestingly with my above analysis for Oil and AUD, I do not think it is very likely that both Oil and JPY will start their slide simultaneously. The scale of my analysis for them is different, with Oil being merely a Weekly reversal/correction, and JPY is Monthly. In terms of the timing them, if AUD/Oil is destined to print a bearish cycle in the next couple weeks, it is very likely that JPY will wait for this long anyway. And with the craziest US election around the corner, any significant positioning on the Market is unlikely.
P.S. In terms of US dollar, note the difference between the last bullish cycle and the current bearish. Also note potential Head and Shoulders on UH and UC – these two pairs seem to have plans to go lower. With UH trading in this enormous value area, starting all the way back in 2012, a significant (in terms of the Monthly chart) bearish trend is unlikely. USD is really asking for another strong bullish wave.

