Weekly Overview – 15-10-2016

15 - AUD COT

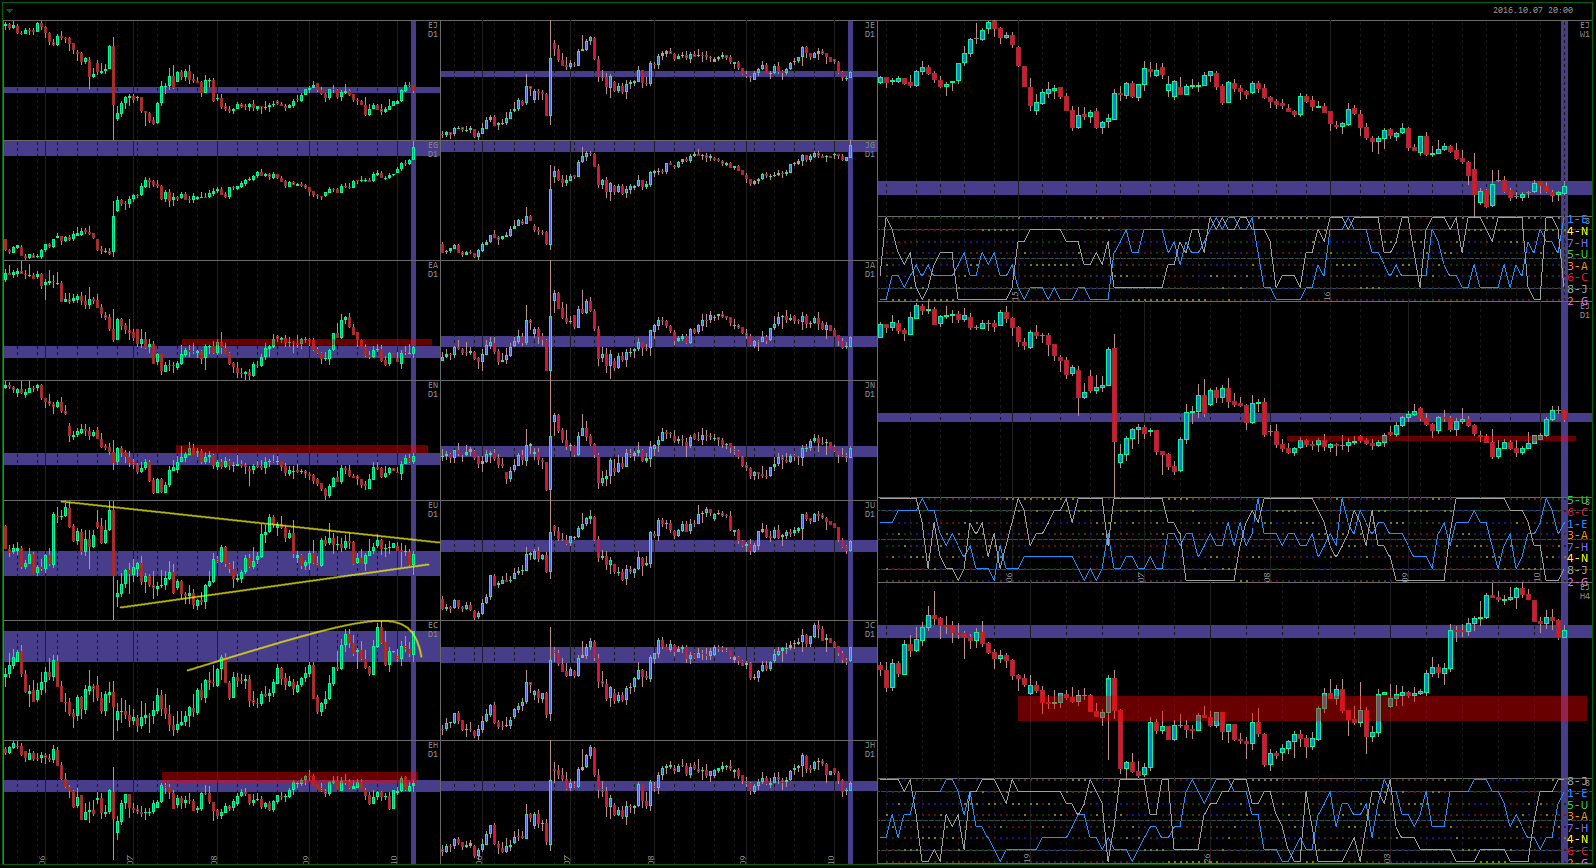
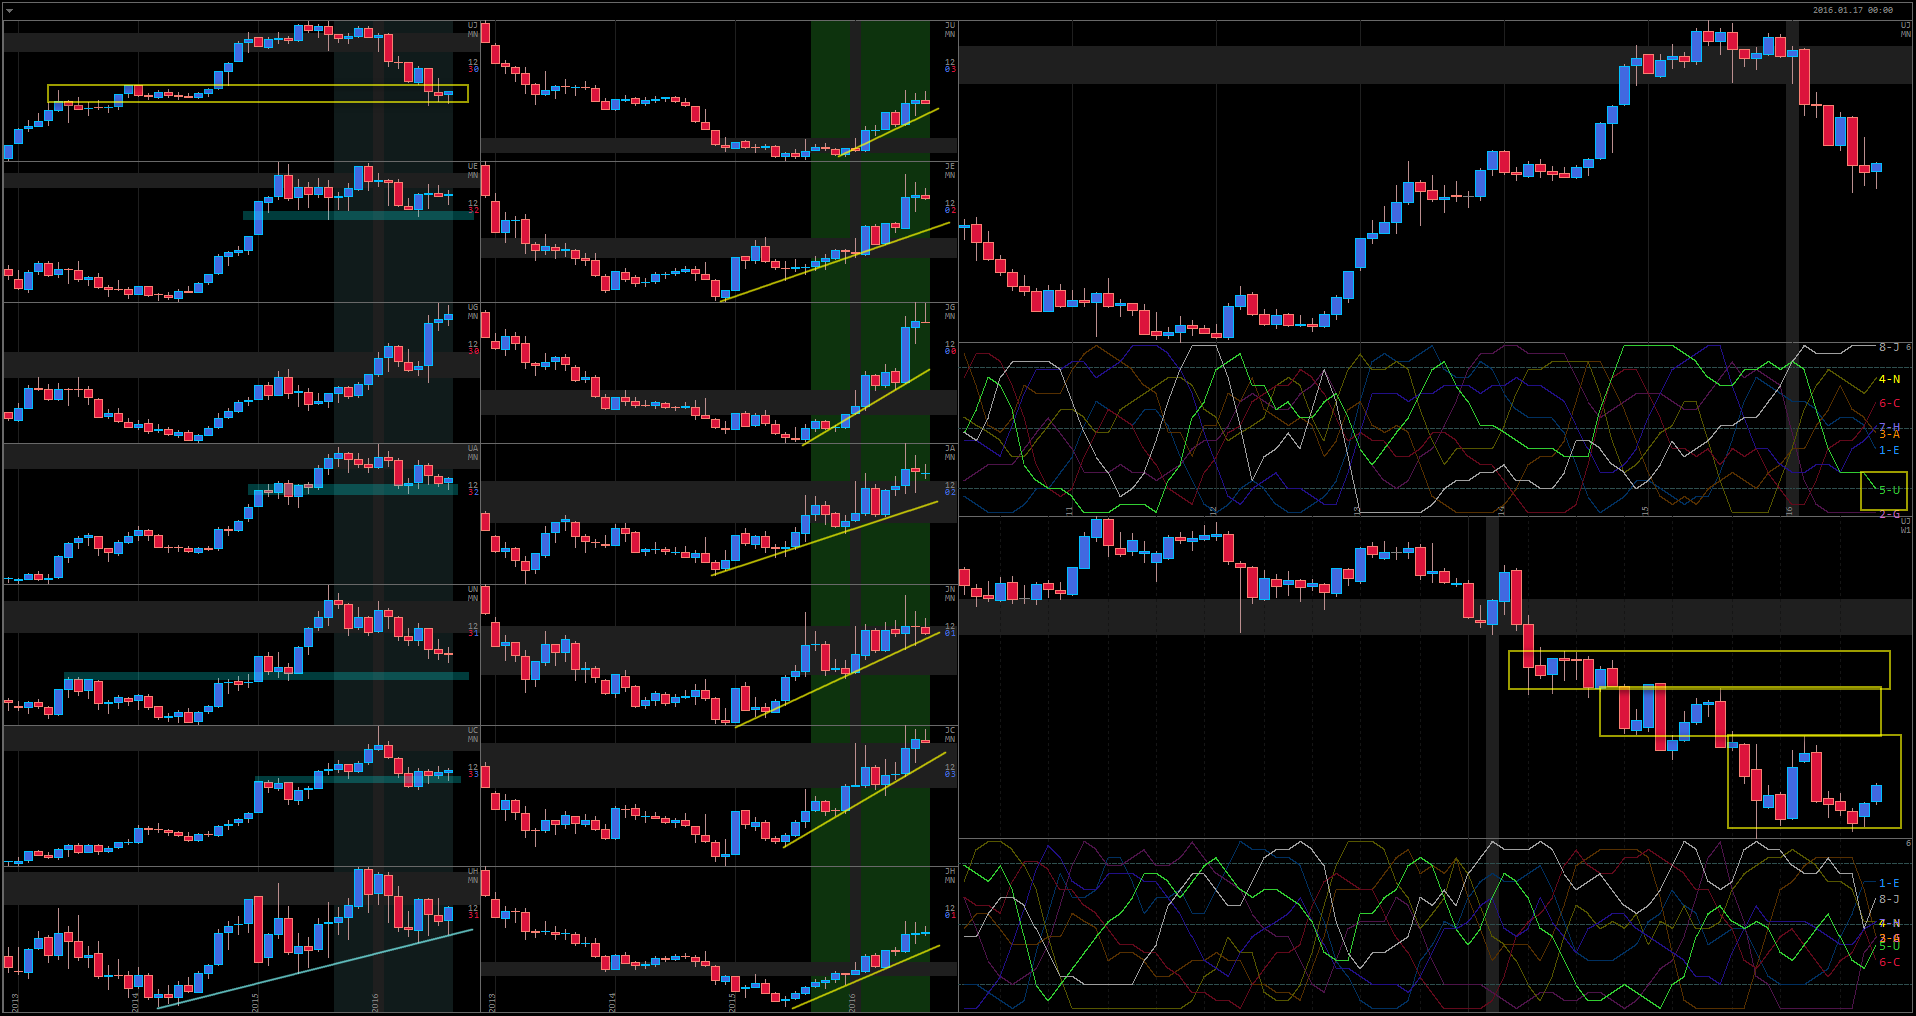
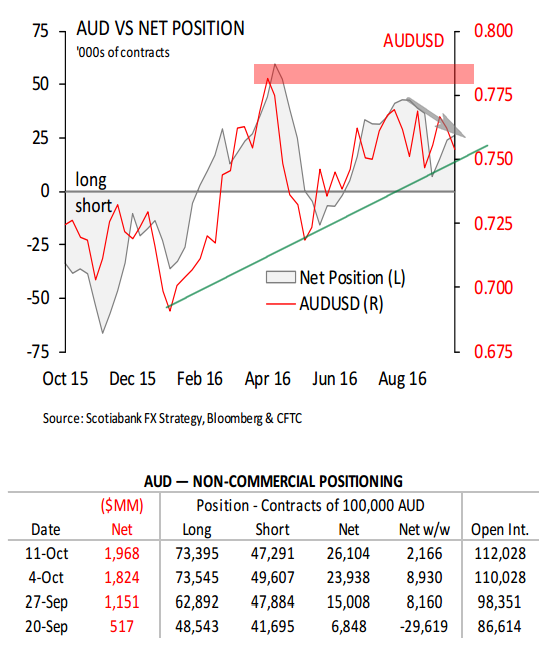
AUD positioning looks very interesting, a possible divergence is forming. Since making that high in long positions in April, AUD was not able to reach it again. The current hesitation signals a potential long term reversal. Let’s tak a look at the chart.

15 - EA W

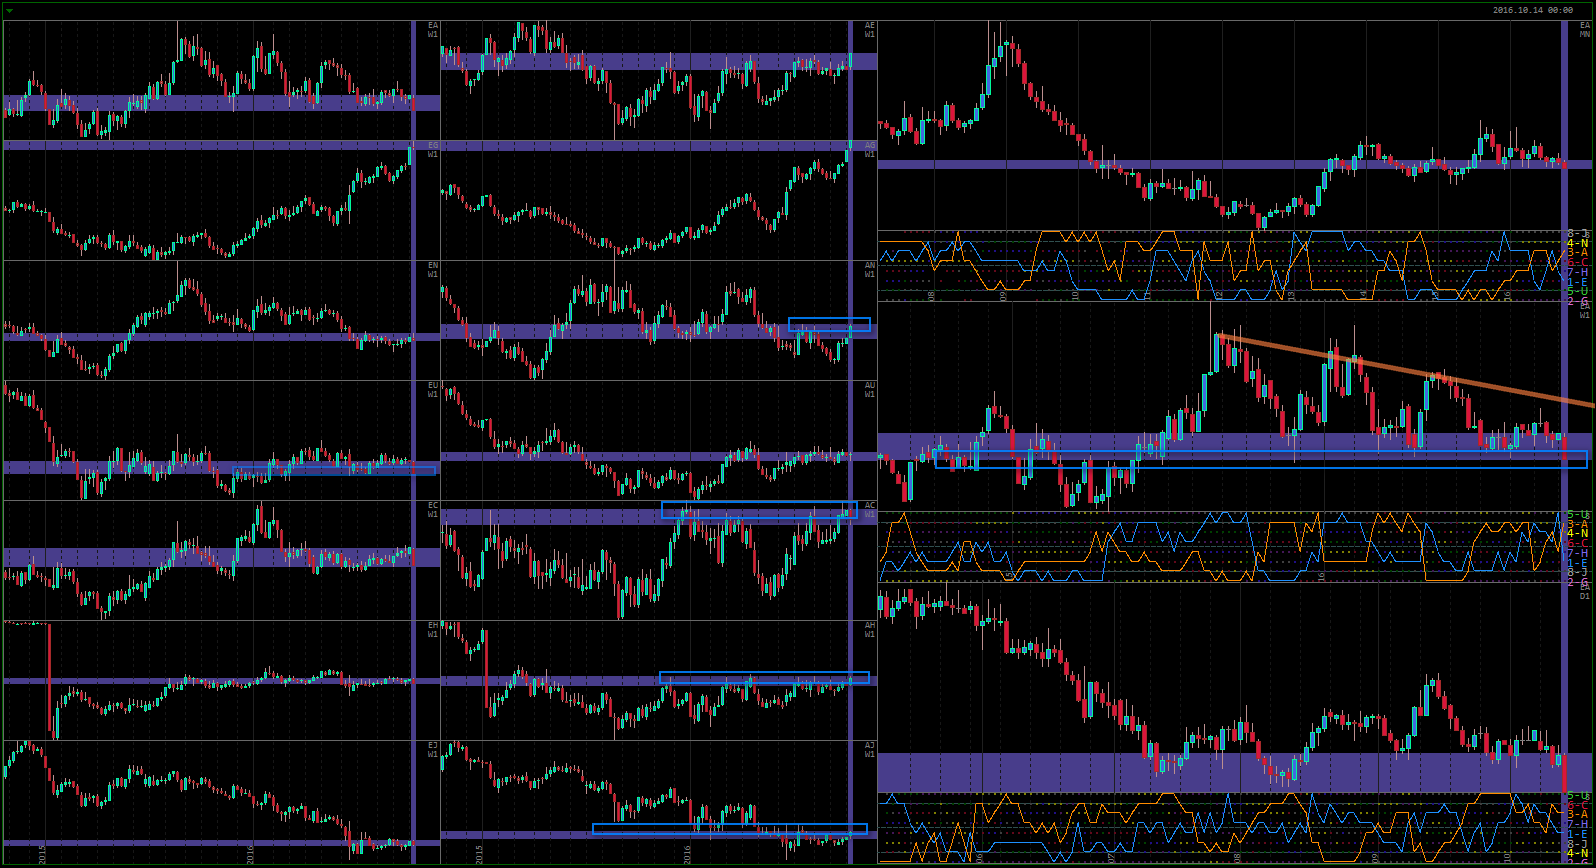
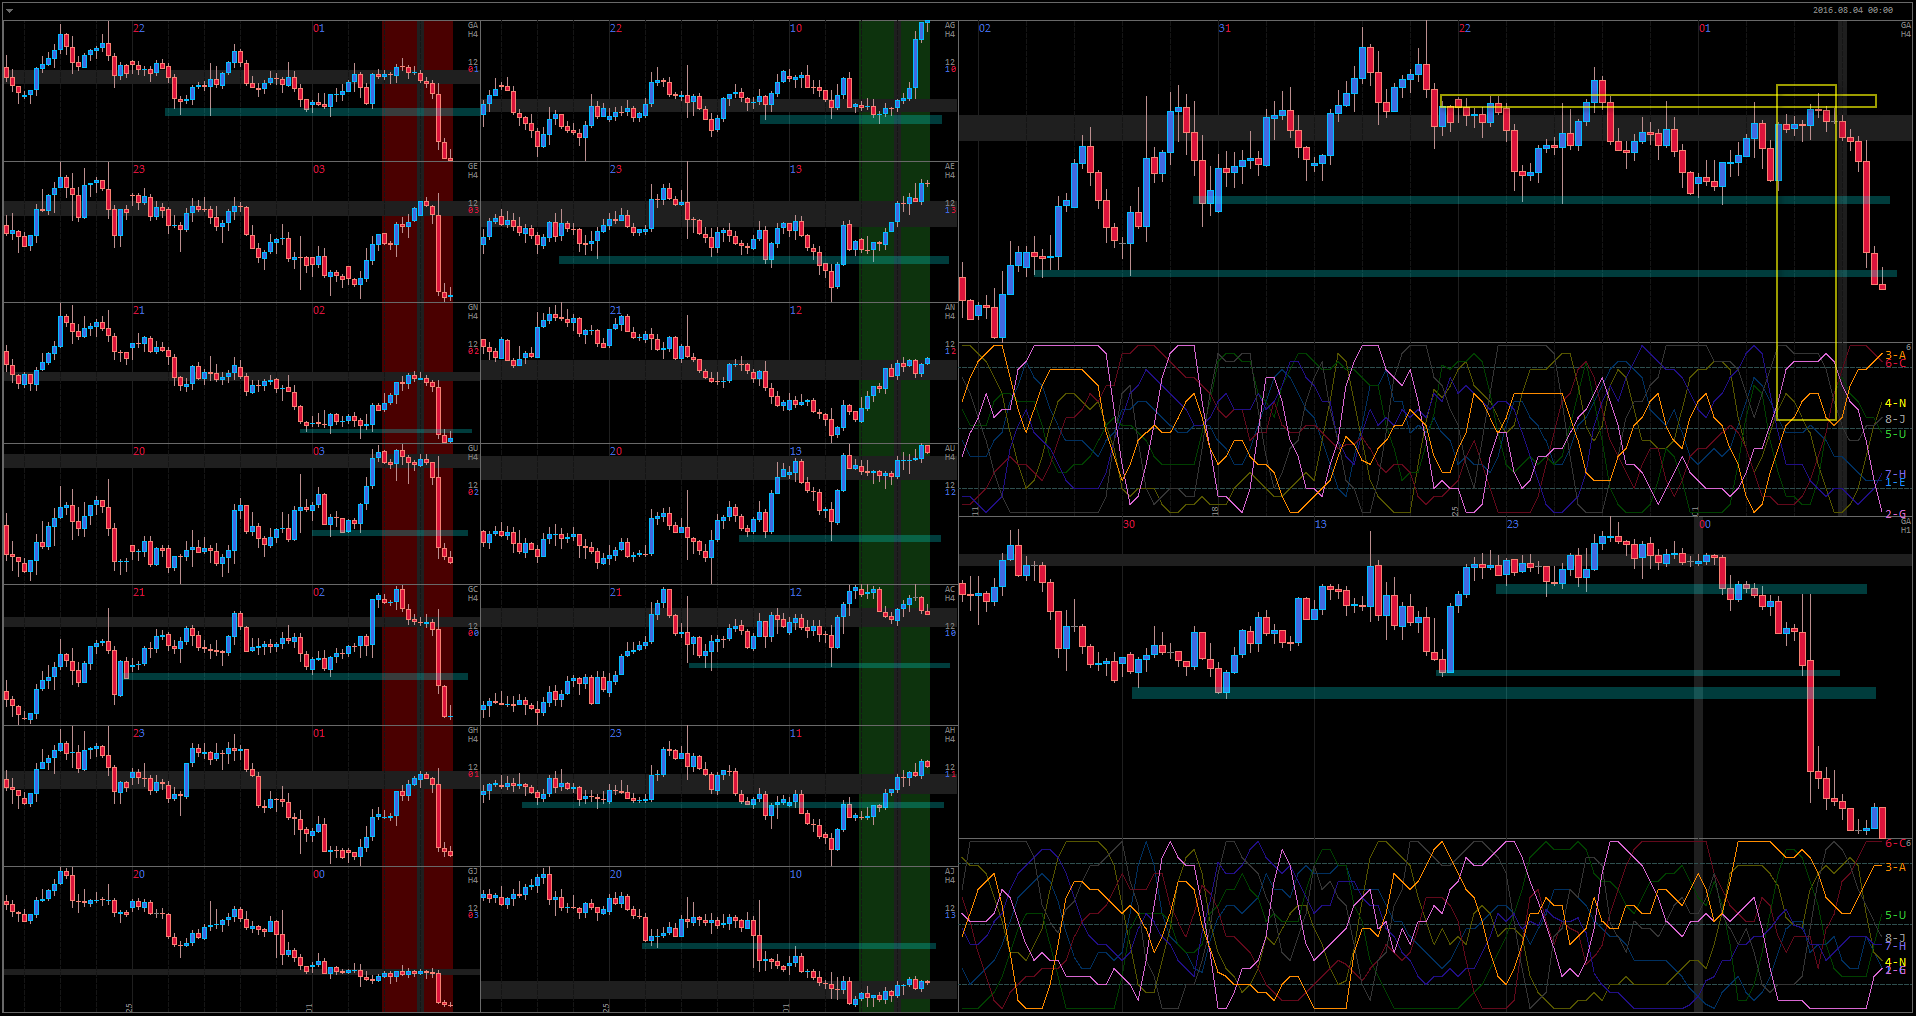
I’ve chosen EA rather arbitrarily, because the other currency really does not matter that much. However, AUD is trading at a very interesting price right now. Not significant resistance that it is facing in pretty much ALL trading pairs. In AG, even though it is not visible on these Weekly charts, the price is reaching a narrow range in which the pair has been trading between early 2011 and early 2014. From technical point of view, the chances for AUD to continue rising are relatively subdued.

Note that on Monthly strength index chart only NZD and JPY are higher then AUD at the moment. What is interesting about AUD is that even though it has a bullish cycle and relative strength (it is actually second bullish currency in the last 6 weeks), it failed to print strong bullish price action. Other than AG (due to Brexit related concerns in GBP) and AN (due to recent decline in NZD), AUD could hardly move higher to any currency.

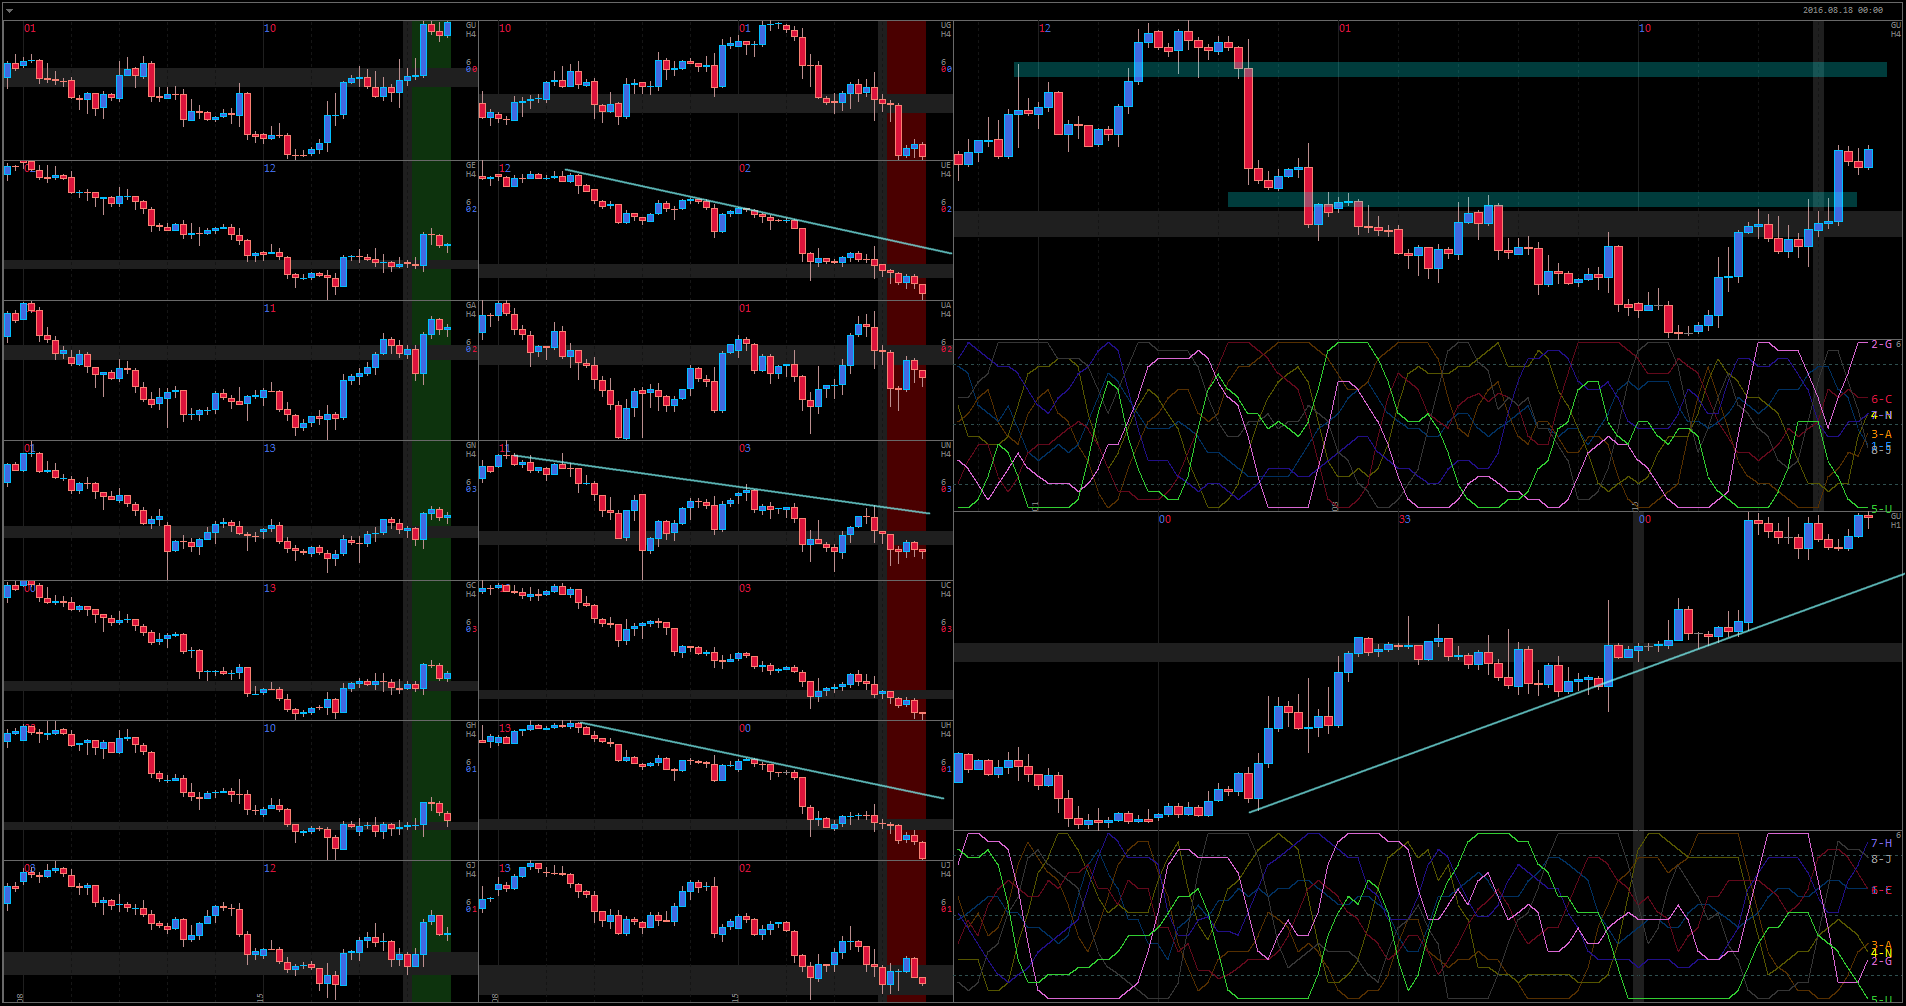
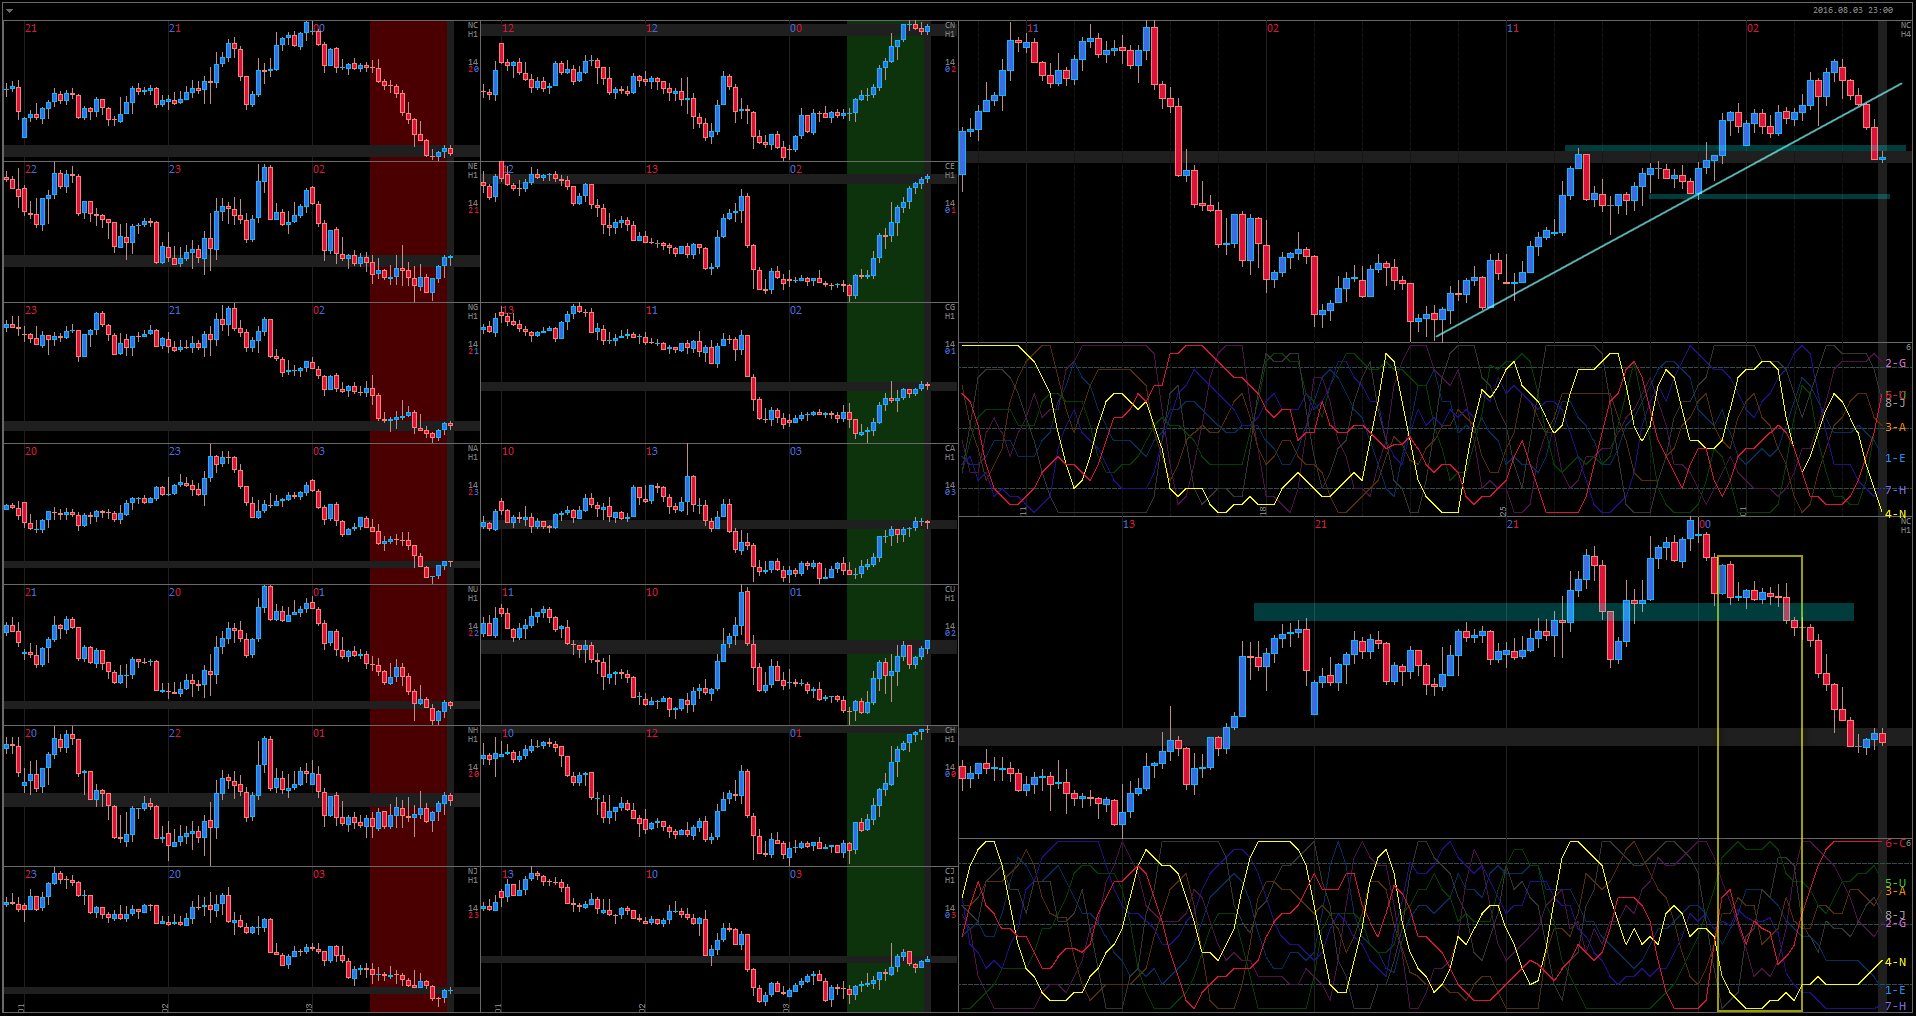
EUR, having closed the week with strong bearish sentiment, is taking EA into that very strong support area that we have already looked at. If price is rejected from here, selling AUD will become irresistable. However, if the coming bearish cycle will be as strong as I expect it to be, there should be no problem finding an entry anywhere during the next couple weeks.

Let’s take a look at the Oil, knowing that it must either stagnate or decline to support bearish analysis in AUD.

15 - Oil COT 15 - Oil

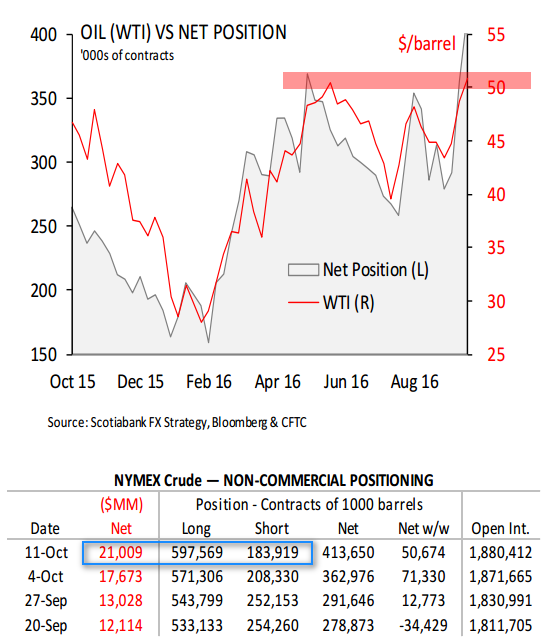
Indeed, both Oil COT and the chart itself look VERY interesting.

COT is showing a great increase in bullish sentiment this week, with 25K contracts covered on the short side and 26K added on the long side. At the same time, the price are facing a very strong resistance area and psychological level of $50. Of course, big traders might know something we don’t that would justify their buying, but it could also be the needed stop run to take Oil lower. If all these traders will be wrong in their bets, the next bearish wave will be very significant.

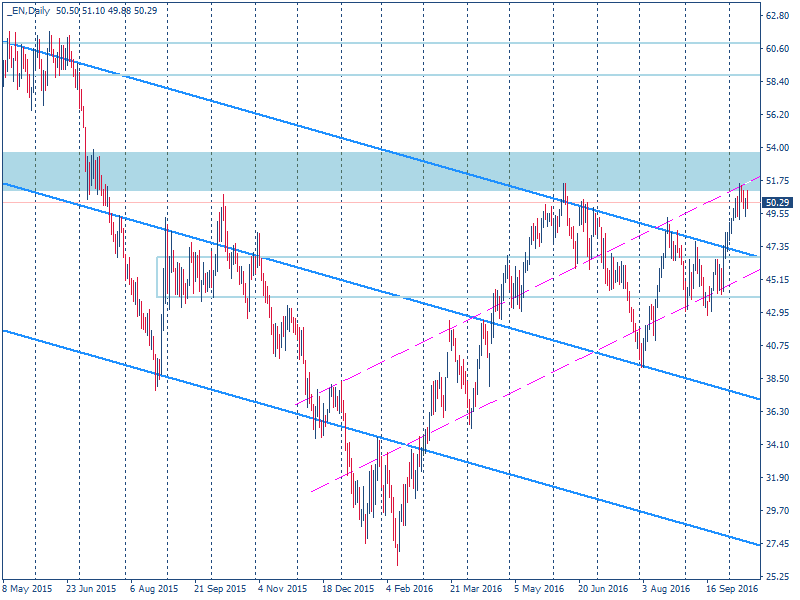
What will happen that will take Oil above $50 right now? Next strong resistance is in the area of $60, but first we need to take out the current level. The price is hesitating doing so for the last 9 days. I myself would never buy here, even on the initial breakout (if it happens).

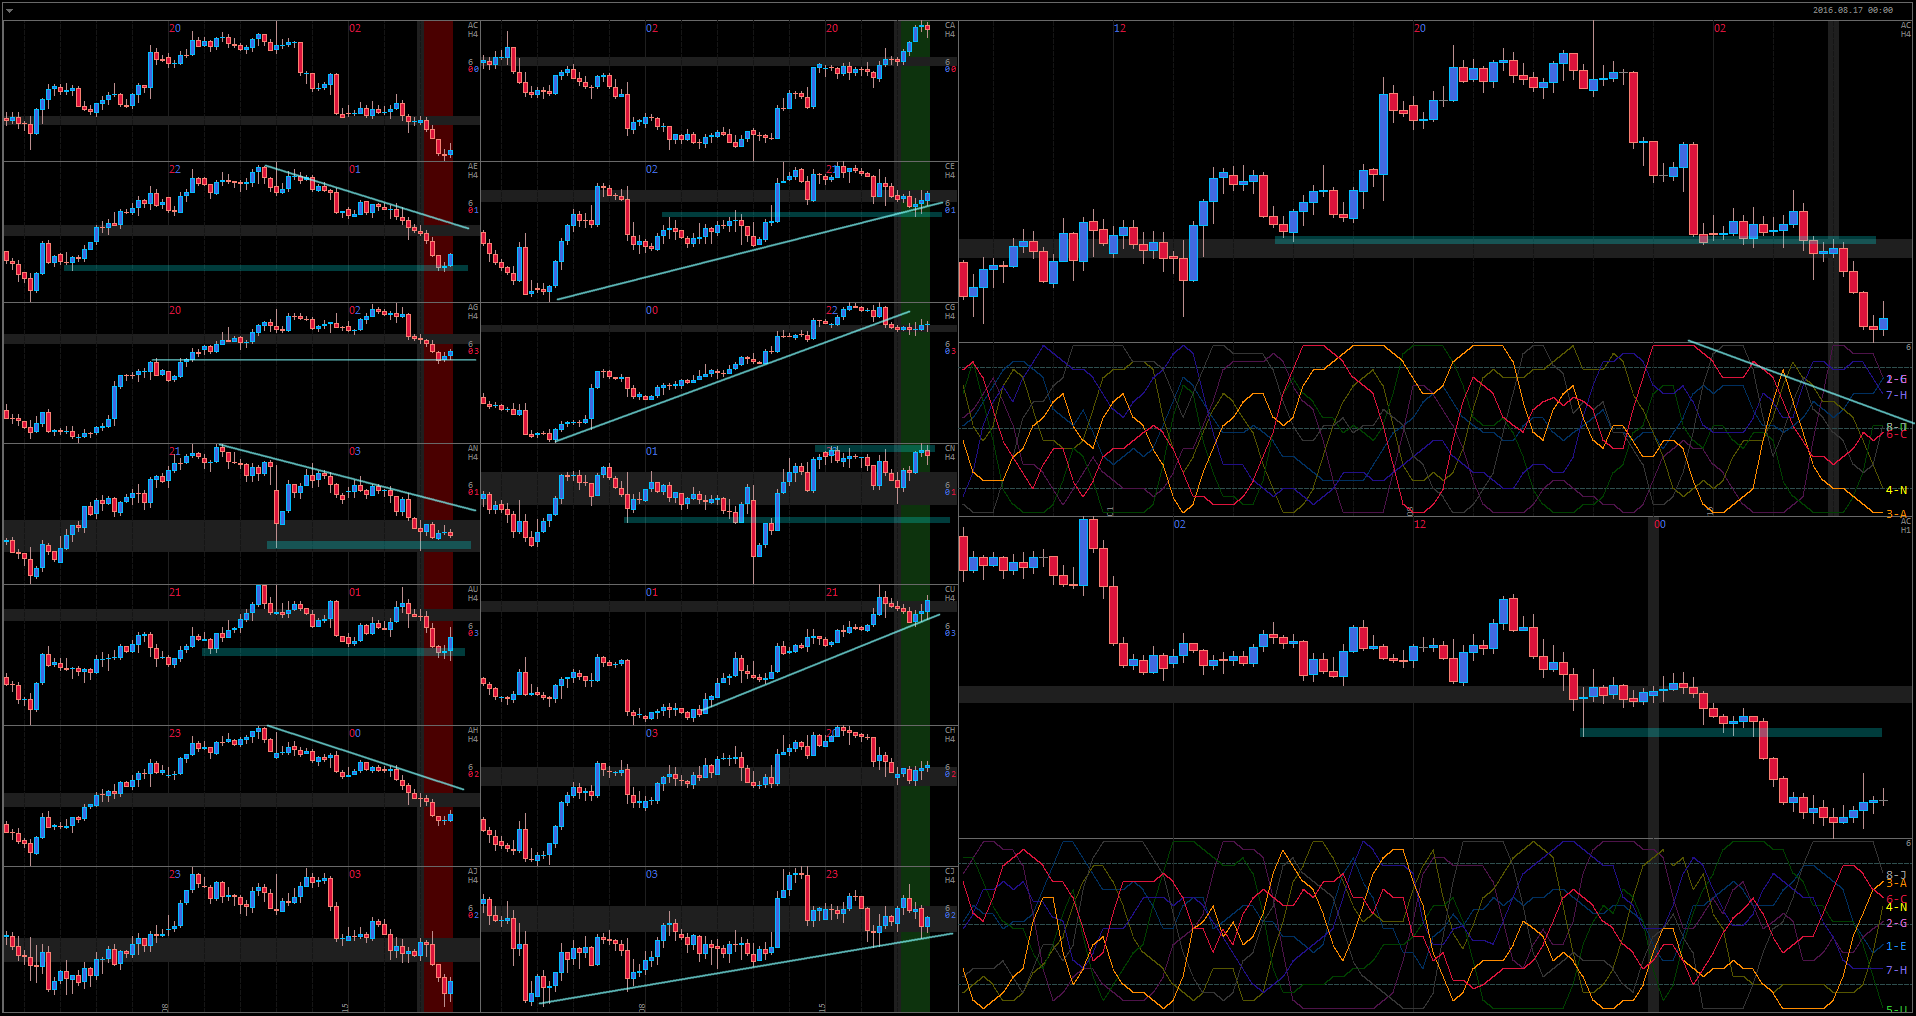
Together with the above AUD analysis, something interesting is certainly building up. My bias is most certainly short, BUT if I am wrong here, the upper break on both AUD and Oil must be great and led by some fundamental events that Market is anticipating.


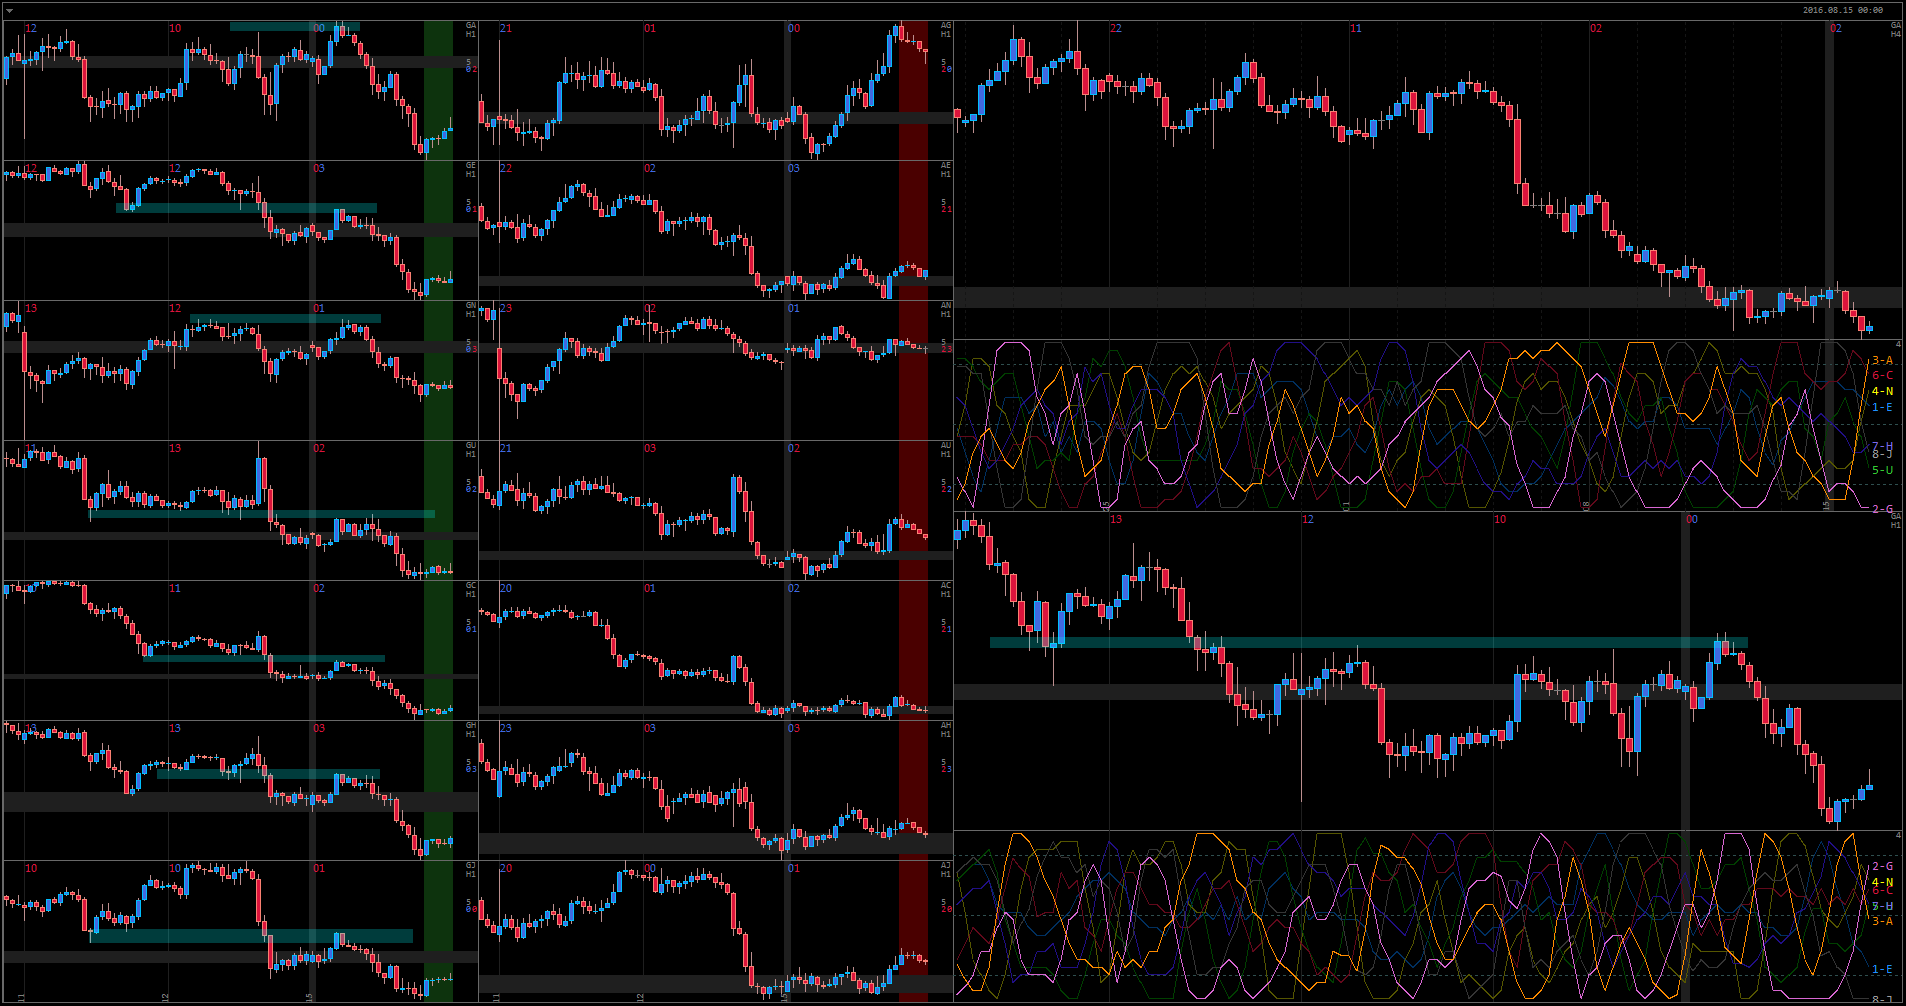
Let’s take a look at another interesting currency that has been on my radar for months now, and yet consistently refused to reverse: JPY.

15 - JPY COT

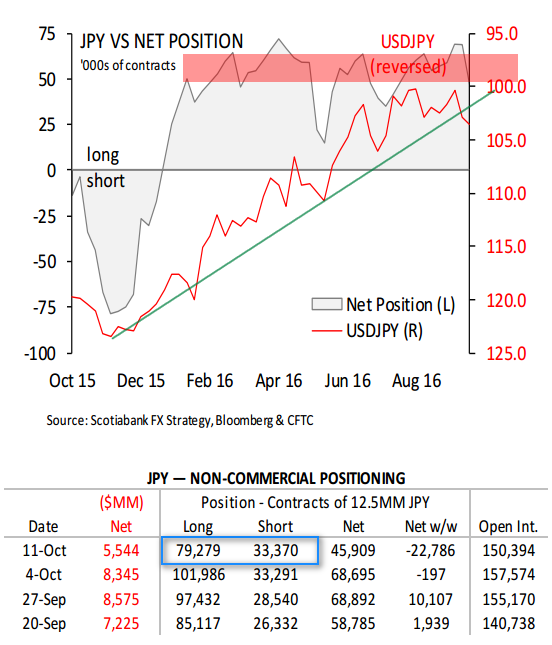
Speculators are hesitating to buy above the current level at which positions are kept for almost a year already. They have tried selling in June, but the Market quickly proved them wrong. However, I cannot see how this enormous bullish cycle (as seen on the picture below) can continue without a significant correction. This week we can see that 22K contracts has been closed on the Long side, with the Short side remaining virtually the same. It is understandable to take a profit at these levels, but what about actually selling JPY?
15 - UJ MN

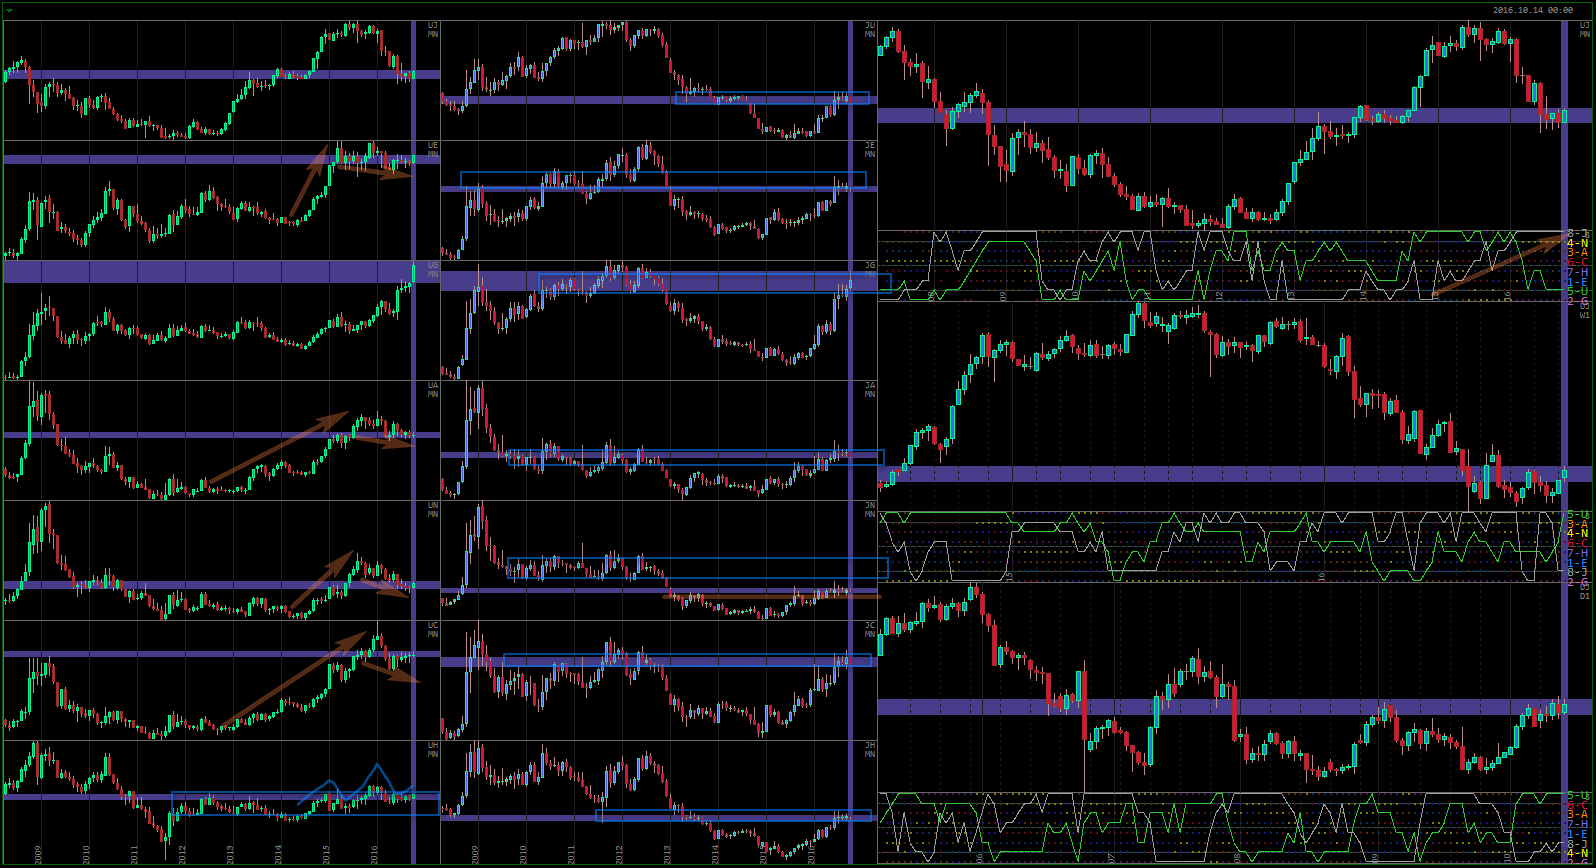
The Monthly chart clearly shows the scale of the current bullish scale. It’s refusal to reverse easily is only understandable – the momentum is just too great. However, I cannot help but notice that JPY is facing some very strong resistance at the current levels or a little bit above. Virtually every pair is either already trading in a huge Monthly value zone (JU, JG, JA), or facing it (all other pairs).

Once again, because we are looking at the Monthly chart, this reversal might take still a long time to fully develop, but we’d better watch out.

Interestingly with my above analysis for Oil and AUD, I do not think it is very likely that both Oil and JPY will start their slide simultaneously. The scale of my analysis for them is different, with Oil being merely a Weekly reversal/correction, and JPY is Monthly. In terms of the timing them, if AUD/Oil is destined to print a bearish cycle in the next couple weeks, it is very likely that JPY will wait for this long anyway. And with the craziest US election around the corner, any significant positioning on the Market is unlikely.

P.S. In terms of US dollar, note the difference between the last bullish cycle and the current bearish. Also note potential Head and Shoulders on UH and UC – these two pairs seem to have plans to go lower. With UH trading in this enormous value area, starting all the way back in 2012, a significant (in terms of the Monthly chart) bearish trend is unlikely. USD is really asking for another strong bullish wave.


EJ potential reversal


GBP continues messing up the markets after the Brexit. Another pointless spike has happened early in the morning, just to close your stop losses with a huge gap and then retrace back to where it was before. Such situations are only further confirming that trading on lower timeframes is not safe any longer. If your stop loss would have been 100 pips, you would have lost “just” 5-6 times your planned risk (depending on how well your broker would execute your stop order). With a stop of 20-30 pips, you would have lost 20% instead of your planned 1%.

07 - EJ

As mentioned earlier this week, EUR has managed to form a bullish cycle on Weekly. However, the price action has been quite week and it does not seem likely that EUR can pull off breaking very strong resistance on almost every single pair (see the picture).

JPY has bounced from its support areas as well, and will possible continue trading in the Daily range, as seen on the charts.

Overall, EJ is a good trading pair to watch for a potential bearish trend.

UC – 5 months of sideways price action

06 - UC

Both USD and CAD have been depreciating to most other currencies, and yet neither managed to trade in a good long term trend. Their cross pair has been trading with very choppy price action for the last 5 months.

Every time we come to the boundary of such range, it deserves our attention. At the moment, both USD and CAD are trading at the top of their respective bullish cycles, with USD barely winning over CAD. This move has taken the price right to the top of the flat boundary. The price has got there without any convincing strength, so it is hard to expect a strong bullish breakout.

Given that USD has managed to reach the top of its bullish cycle even on Weekly, without showing any strong price action in that cycle, it does not seem likely that it will keep on appreciating. CAD however, being at the bottom of its bearish cycle on Weekly, has more potential to go higher for a while.

It is very likely that the price will stay in the range, but thanks to its considerable size, we can still trade UC on the short side.

Something is building up

The market has been stagnant on higher timeframes for a long time right now. After the Brexit and before US election the money is hesitating to move.

05 - UJ

UJ continues moving in the same range for the fourth month. USD looks like a complete mess on daily, with most pairs showing very choppy price action. JPY has been creating some cycles, notably with increasing bearish strength.

How much higher can JPY go without a significant correction? If the last 3 months has restored the balance on the Market and if JPY is unable to descend soon, the bullish cycle will continue with some significant strength. Notably, most JPY pairs are breaking their Daily trendlines right now. Notably also is that no JPY pairs (other than GJ – barely) have managed to break their Brexit highs.

05 - EG

EUR has been probably the most flat currency in many, many months. Looking at its cycle (blue line on the right Daily graph), it has barely managed to reach the high on a couple ocassions, just to be instantly rejected – not the most bullish sign. Looking at the currency profile on the left, the market has found value on this currency on almost all trading pairs with an interesting triangle on Weekly on EA and on Daily on EU (see first chart).

GBP on the other hand is trading in a seemingly permament bearish cycle. It is testing post-Brexit lows right now, for the third time in 3 months. The main question is – how much longer can this trend continue? How low should it go that traders would refuse to sell? If the price shows acceptance just below the Brexit lows, we are in for another ride.

Interesting to note though, that GBP is starting a bullish correction right now. The price action of the next 2-3 weeks could help to see the picture more clearly.

USD and JPY, long term overview

31 - UJ MN

Despite all the doom and gloom that most analytics suggest for USD, price action suggests otherwise. To me it is always important to compare economic events with traders’ psychology I am reading on the charts.

USD has been trading in bearish cycle on Monthly for almost 2 years now. USD is the most bearish currency in that time frame, right after GBP. Additionally, COT reports has been showing increasingly negative sentiment for USD (which did recover in the past months). Fundamental releases were pretty negative for USD as well, and US economy is far from doing well. FED is unable to hike rates even by another 0.25%. So where is a huge USD trend reversal?

The only significant bearish move between all USD pairs was seen in UJ. If we look at the USD profile overall, it has barely corrected to its strong bullish trend. Not only that, but it is approaching strong support areas right now. If bears were not able to show significant bearish cycle when everything was going against USD, I am fully expecting the coming bullish cycle to be strong.

Of course, a reversal of Monthly price action will take time, so we are planning the next 6-12 months here. USD might go lower for a while, but it doesn’t look like the Market is accepting it at these prices very well.

Looking at JPY, which was undoubtedly the strongest currency during he last 2 years, it is also approaching a point where traders are not willing to pay this much for it. UJ in particular is trading in a very important Monthly support area, as seen on the chart. With such expensive Yen, Japanese government is in trouble. They’ve been trying to stop the trend, quite unsuccessfully during the last 6-12 months. However, right now we are at a point where speculators are finally going to help BOJ and start selling JPY.

As usual, it is crucial to watch price action in real time, to adjust our plan as necessary.

August 18th – GU

18 - GU

GBP is possibly starting a Daily reversal. It’s been oversold for way too long and no one wants to sell further at these prices. However, right now it is finishing its bullish cycle on H4. I want to see the price action in the coming bearish cycle, and if bears will show weakness, GBP will be probably the best currency to buy at the moment.

USD is the strongest bearish currency today, but it does not look just as convincing. There is definitely pressure building up, as many pairs face significant support. However, it is finishing its bearish cycle on Daily (with relatively weak bearish price action) and also on H4. UN and UJ look like great trading pairs to buy for the mid term.

August 17th – AC

17 - AC

CAD is clearly losing its bullish momentum. It is the strogest bullish currency today, but it is unable to make new highs, facing strong resistance in many pairs. There are still many TLs in CAD profile that needs to be broken before the trend reversal is confirmed, but CN is already offering a great selling price.

AUD is the strongest bullish pair today and it is still going strong. The price is correcting on H1 right now, but bullish price action is quite week in most pairs. However, AU and AN look like renewing the highs – all bearish attempts have been rejected in the last 2 weeks.

GA

15 - GA

GBP has started the day rising, but it was facing many resistance areas from the previous week, breaking which would have been too much to ask for.

AUD did not really grow today, if we look at other trading pairs. Other than AG, only AU was more or less bullish. AUD is very likely to continue its Daily bearish cycle.

GA – BOE rate cut

4 - GA

A strong bearish move in GBP due to the rate cut today. It will be interesting to watch if GBP sustains this move, since it is meeting support areas in some pairs (GE, GN, GU, GH).

AUD was the strongest bullish currency of the day, but most AUD pairs have struggled to push higher (AU, AC, AN, AJ). AC and AU offer good selling prices.