30th of November 2017

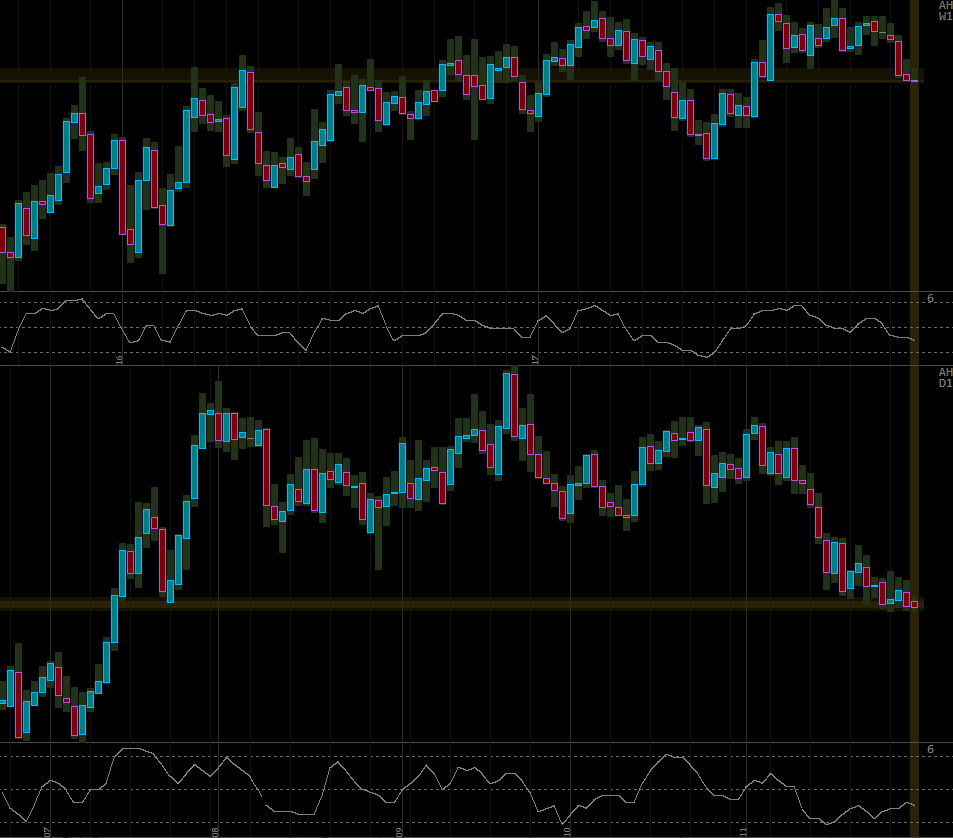
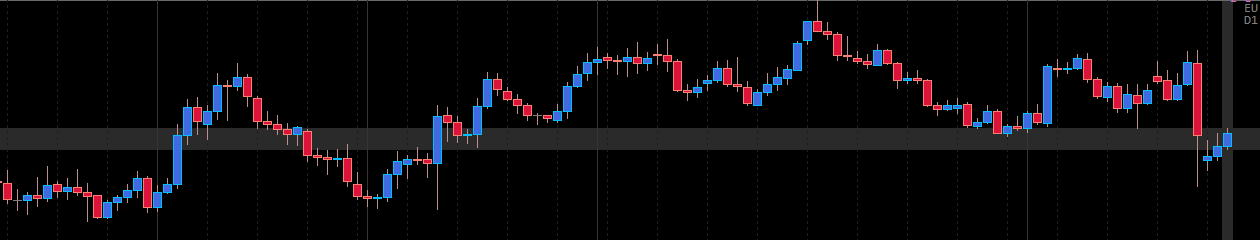
As we approach the bottom boundary of this 2 months long range, I am watching closely for a breakout. EG might be preparing a Weekly trend reversal.

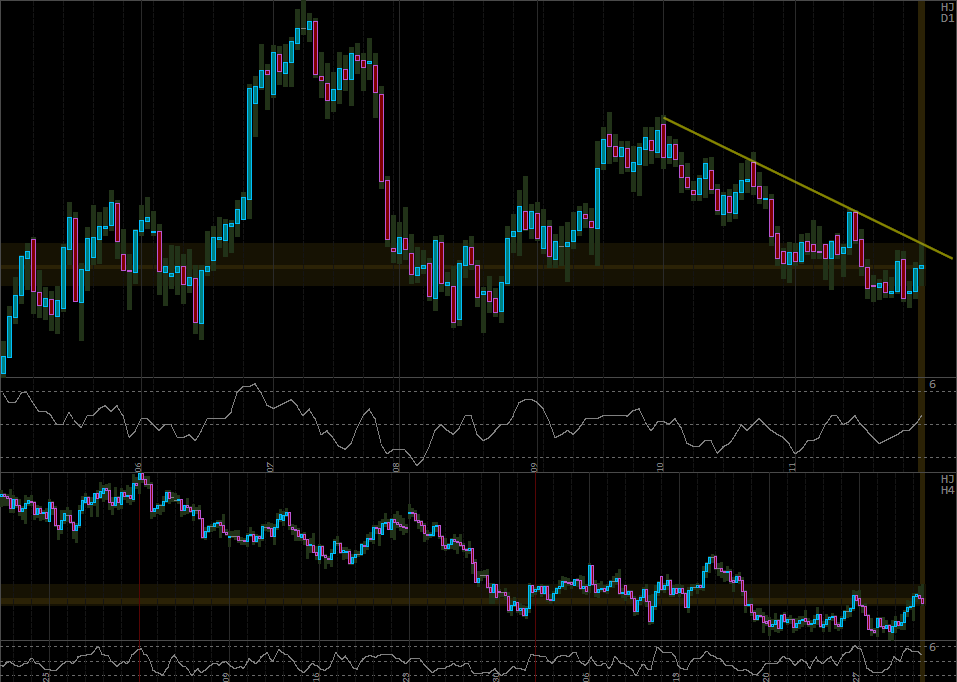
Price failed to reach the lower support, and trend remains down, albeit very slow one. On H4 price is being rejected from the most recent swing high – expecting another retest of the lower support.

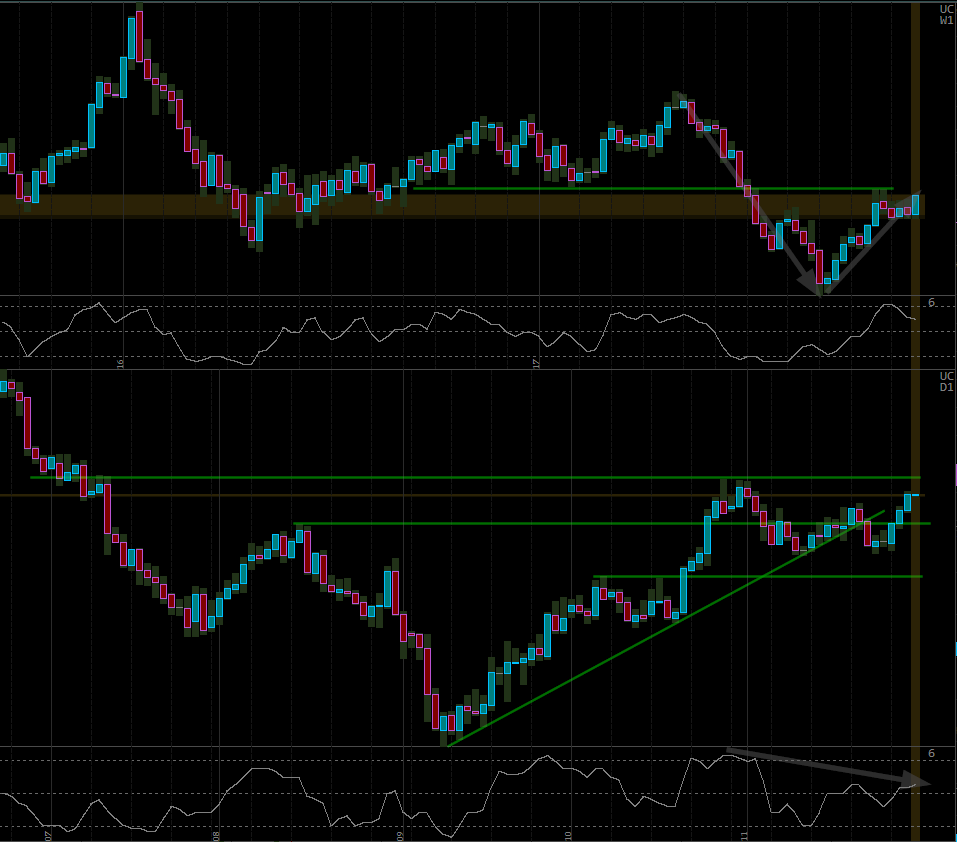
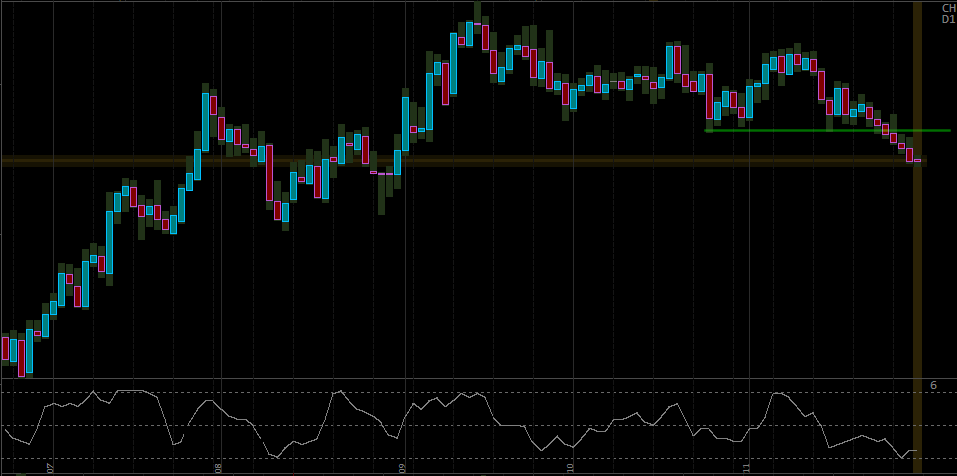
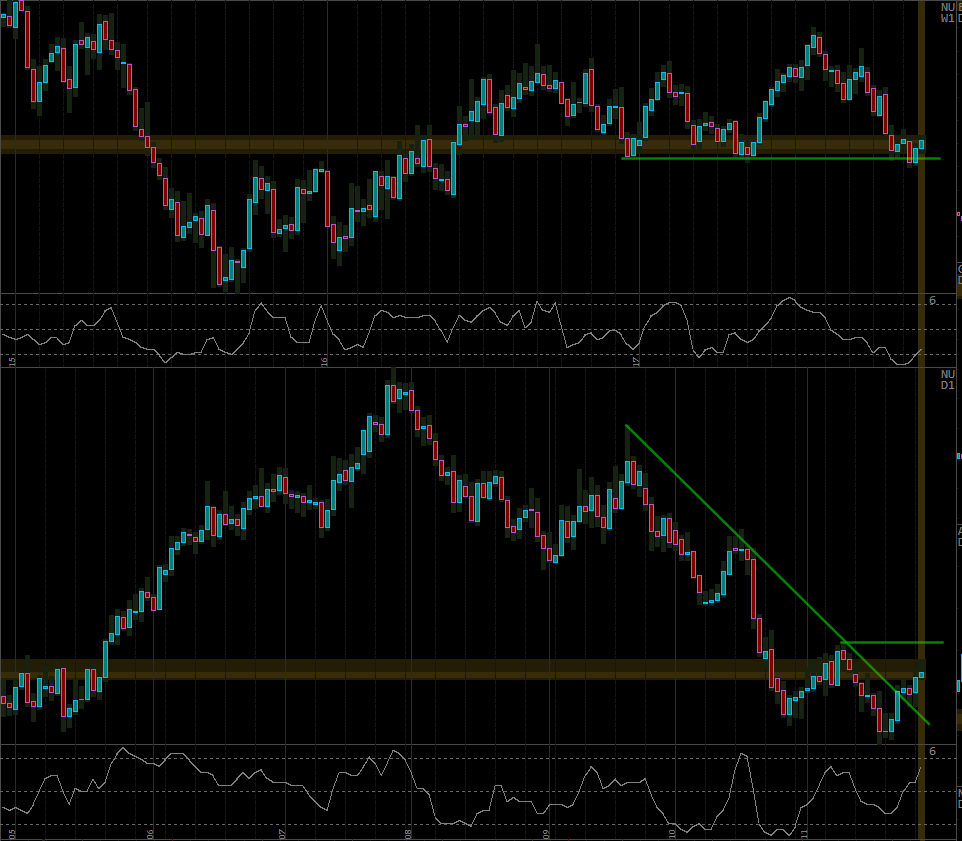
Similar to EN, price is very tempting to Sell, but all we’ve got so far is somewhat slowing Bullish momentum, with Bears showing little signs of strength. If the price starts breaking through the indicated levels on Daily, Bearish argument will have much more going for it.

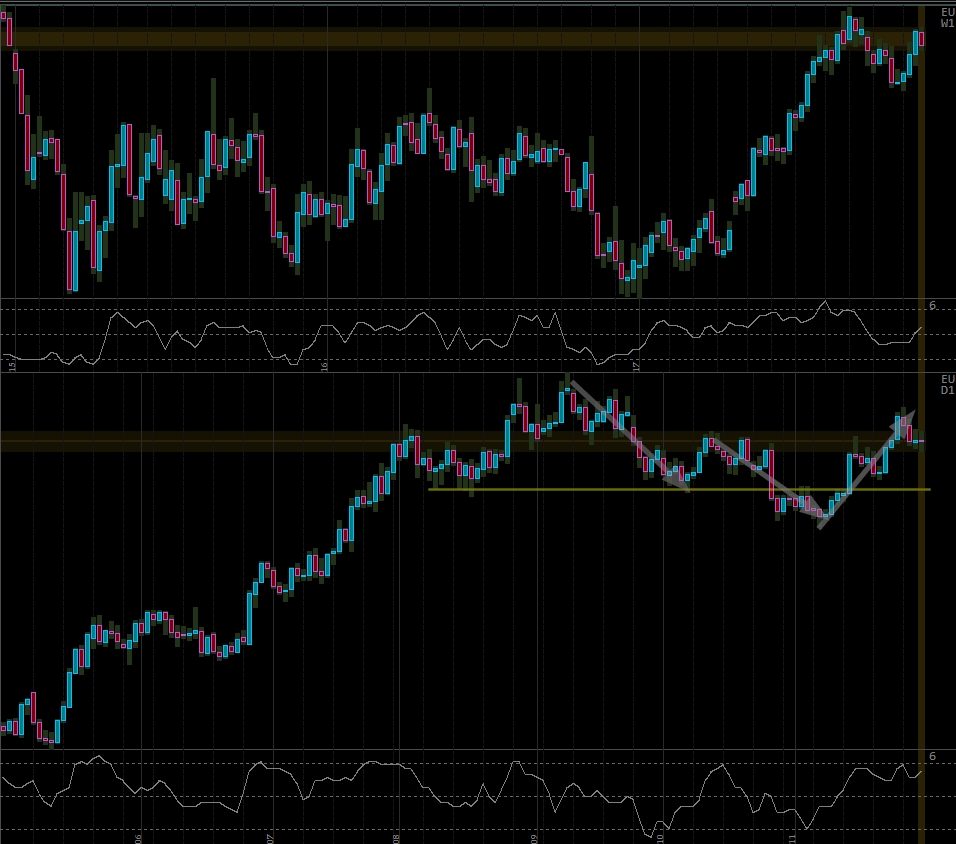
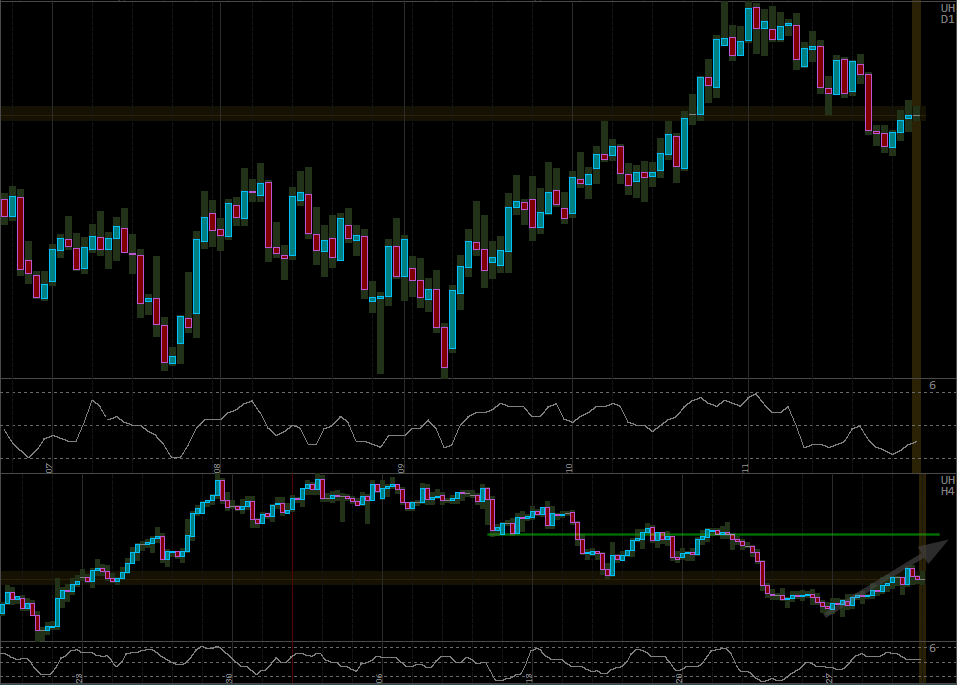
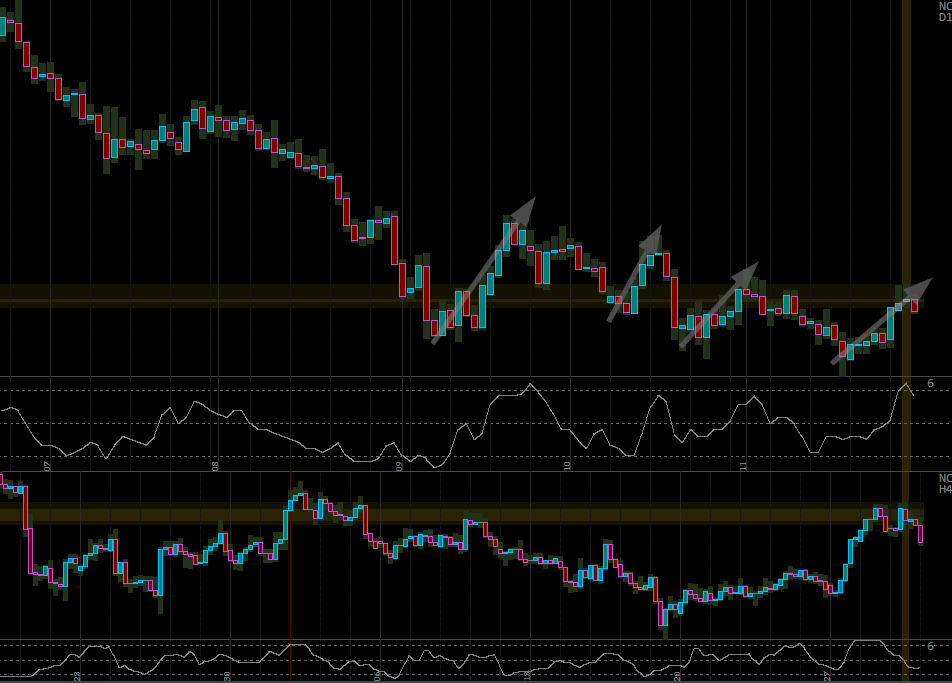
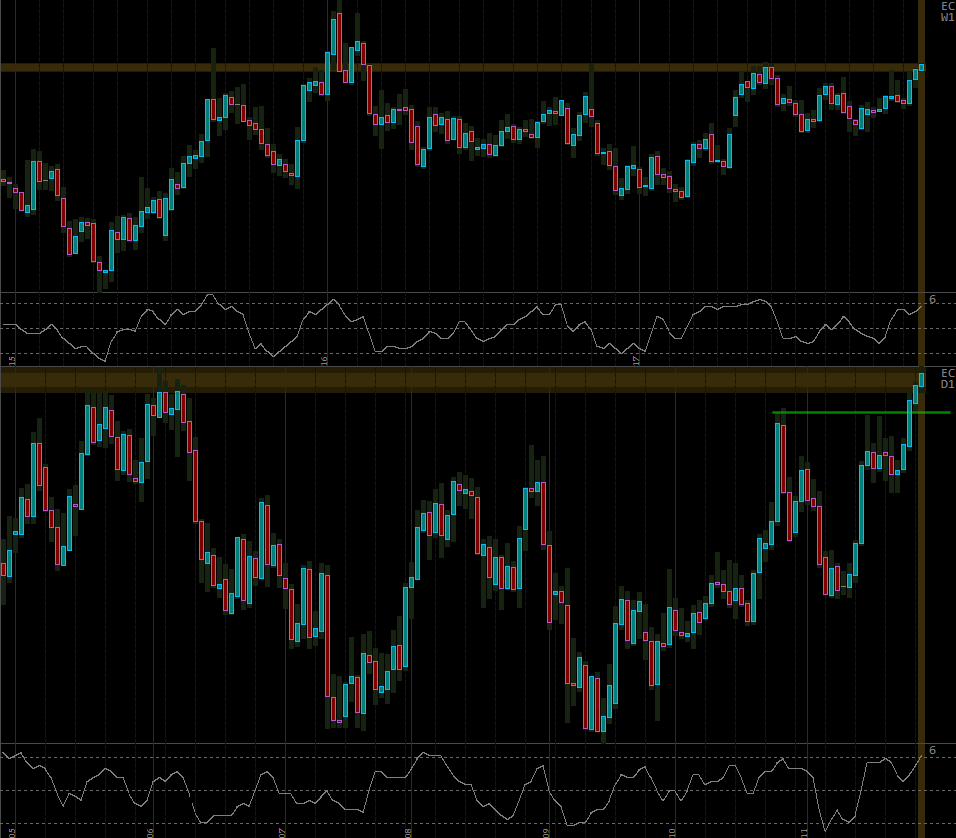
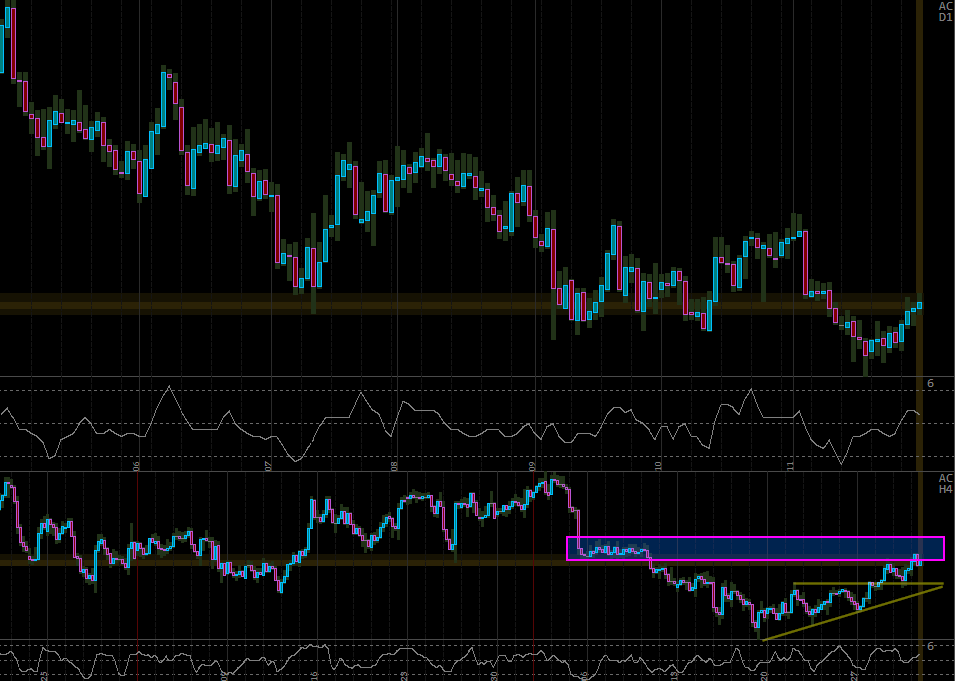
Bears had something going for them when they pushed into the indicated support (first down swing), failed to break it, but then attacked again with increased strength. It was painful, no doubt, to see all their efforts erased in the current Bullish swing, going as far as breaking the previous swing high.

Given the stronger momentum of this Bullish swing, I am fully expecting another retest of the high. The overall Bullish environment on Weekly also helps.

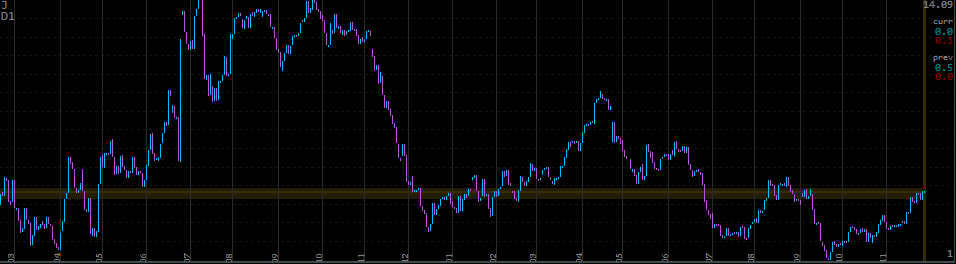
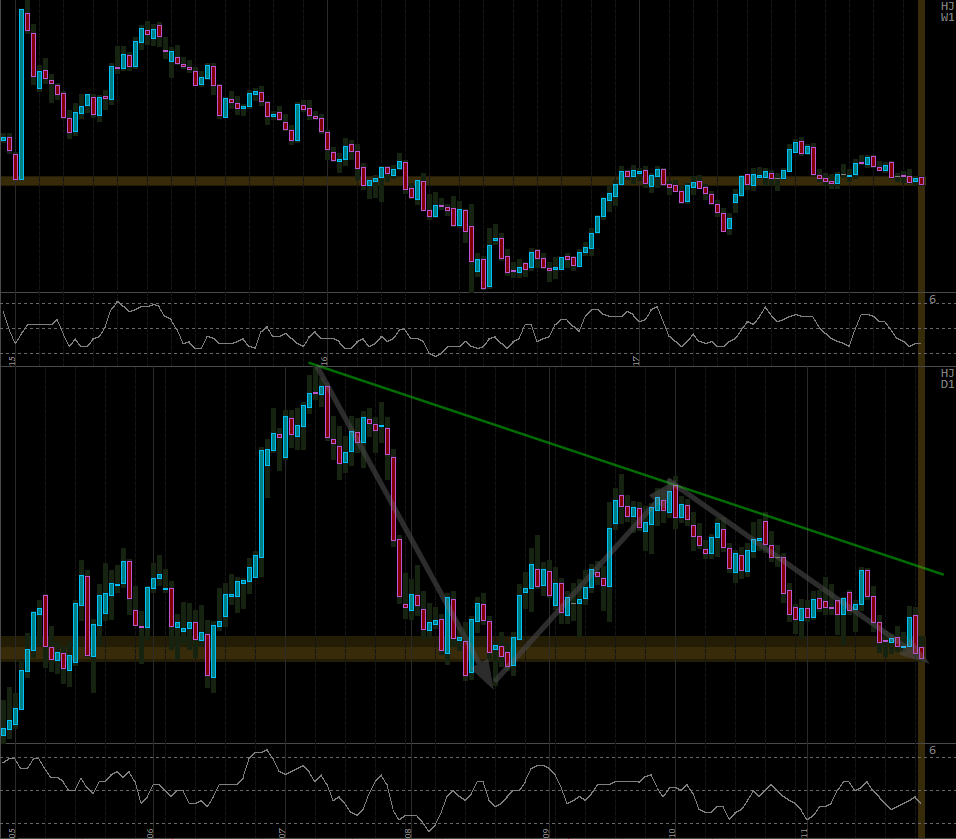
This is a decent little Bullish correction, offering an acceptable Selling price, but I am not eager to add to my NZD shorts or JPY longs. At any rate, not on the approach of the major support on Weekly. If price slowly reaches towards the TL I may reconsider.

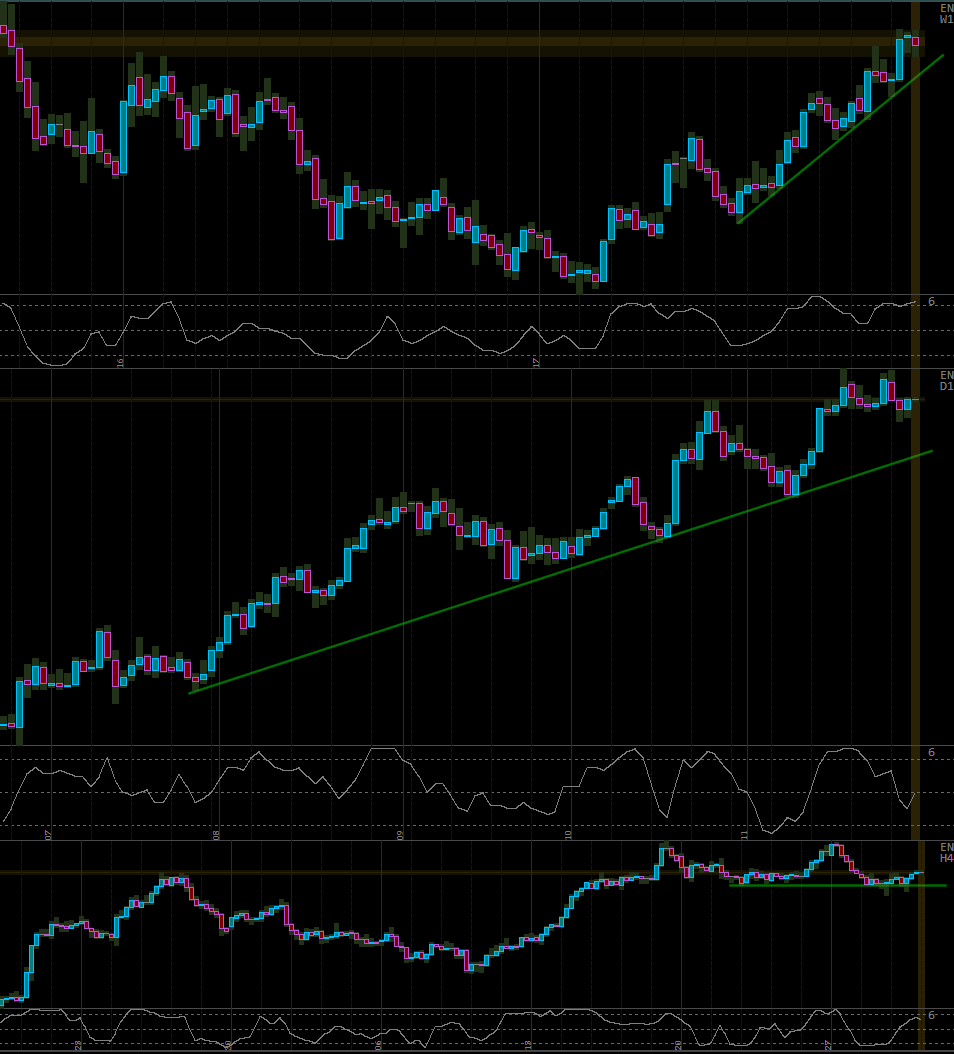
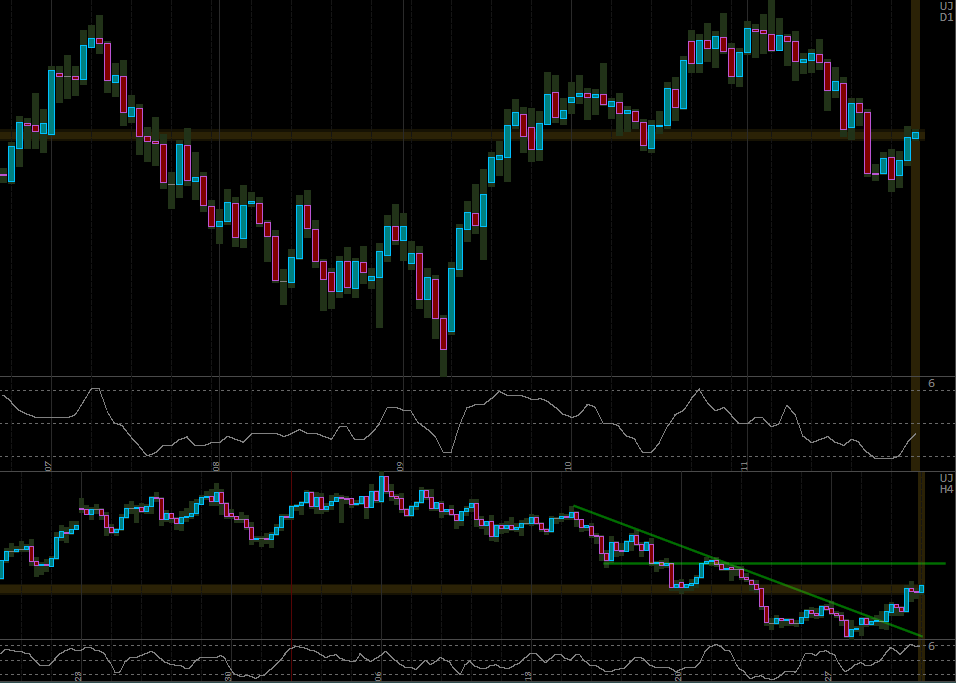
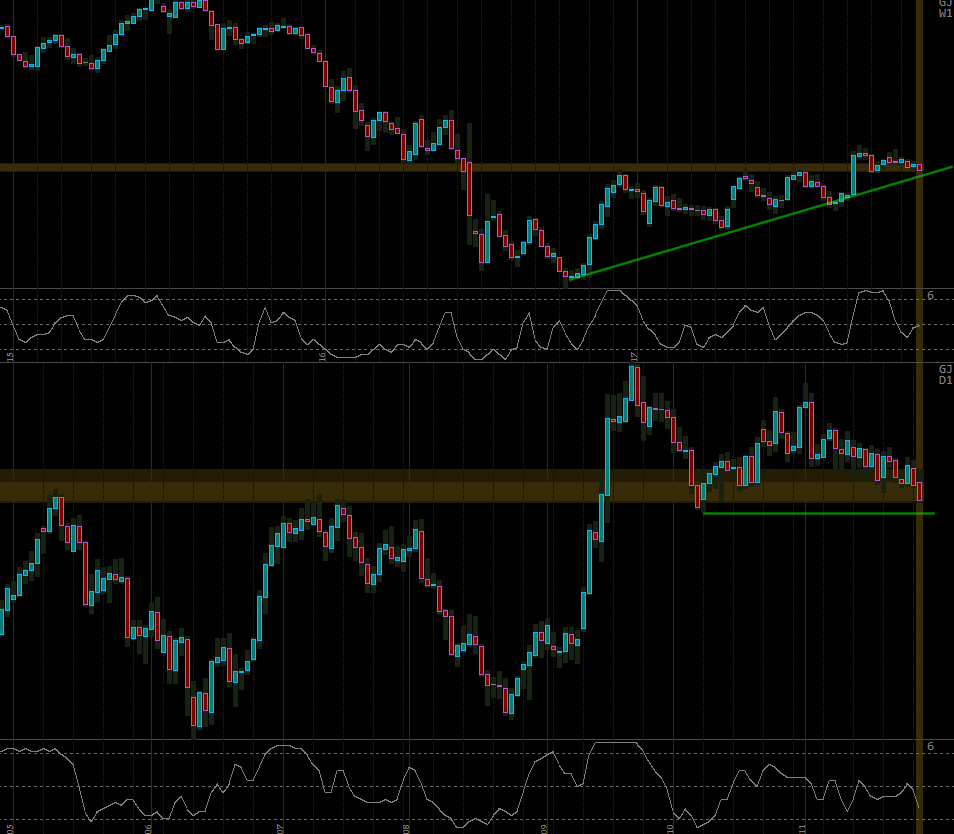
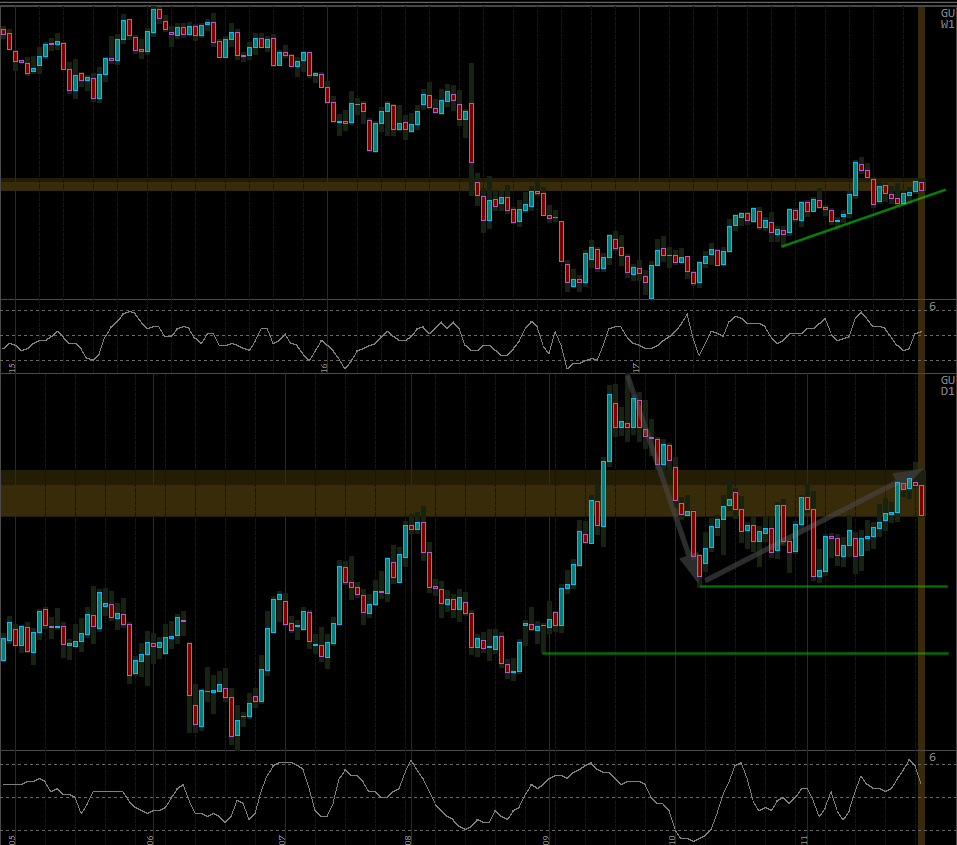
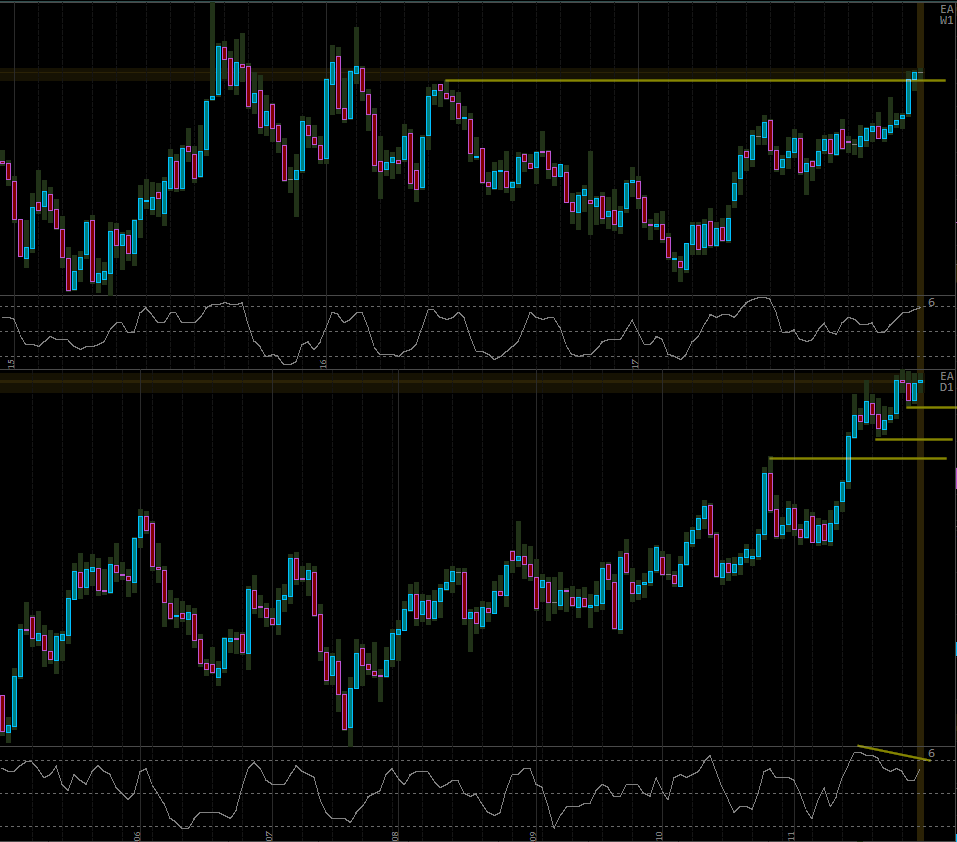
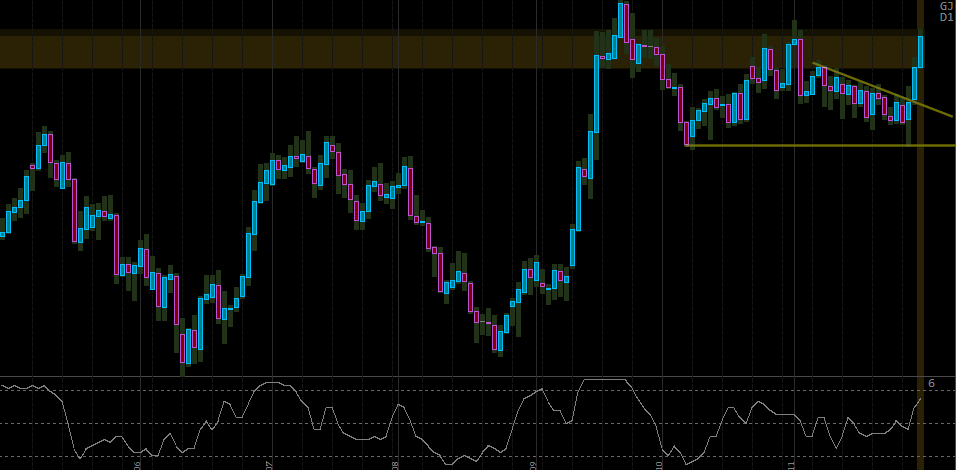
Just like many other EUR pairs, the price is tempting, and the consistent slowdown in Bullish momentum helps too. And yet Bulls manage to push higher, while Bears fail on each subsequent approach to the TL. Right now we are at a point when something has too give, with triple high above and TL right below. A reversal might not be very far, and any failure to break higher will offer a selling opportunity.

Note also that we are right where we were before the collapse on 15th of January 2015 – that was a long way up and it took 3 years to undo one day’s damage.

This is one of the worst situation for any trader, when you make the right call and yet miss an obvious rejection entry trigger, only to see the price rally without ever looking back, hoping that it offers at least some kind of correction. Live and learn…

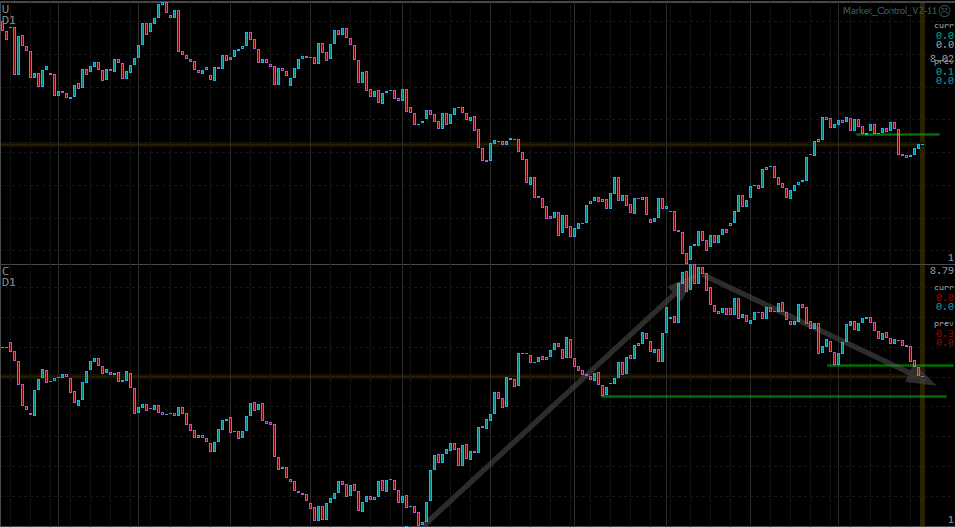
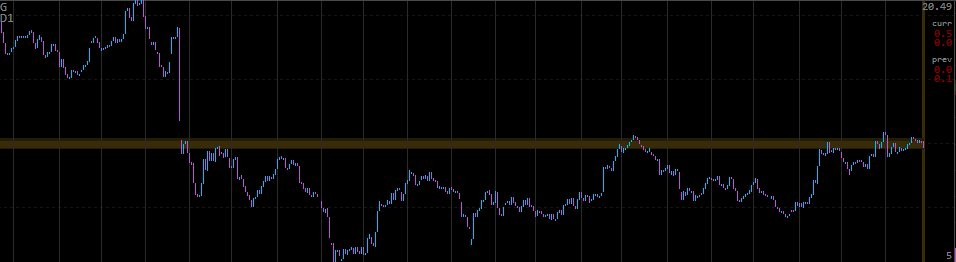
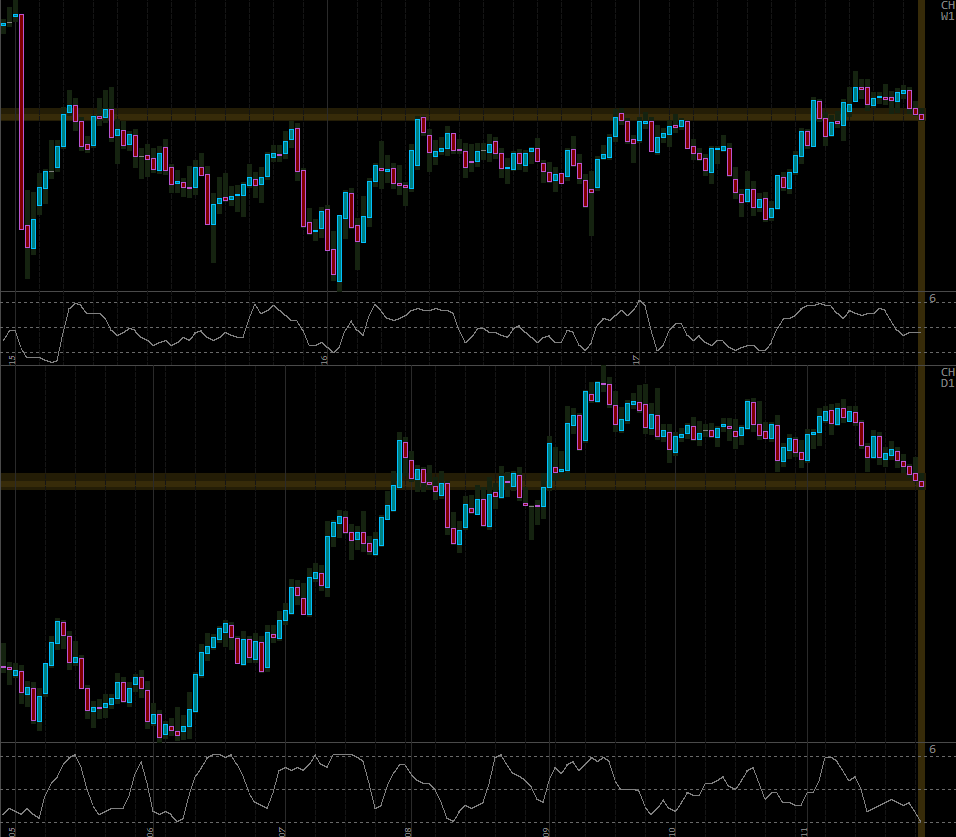
Price continues higher, and while the correction looks tempting on Daily, I am not eager to become more exposed on CAD – not just yet. Let’s see if that’s little congestion area on the left offers any decent resistance.

Speaking of CAD, it has managed quite a push lower in the recent days, and unless it shows some Bullish strength, I just might have to reconsider my views.

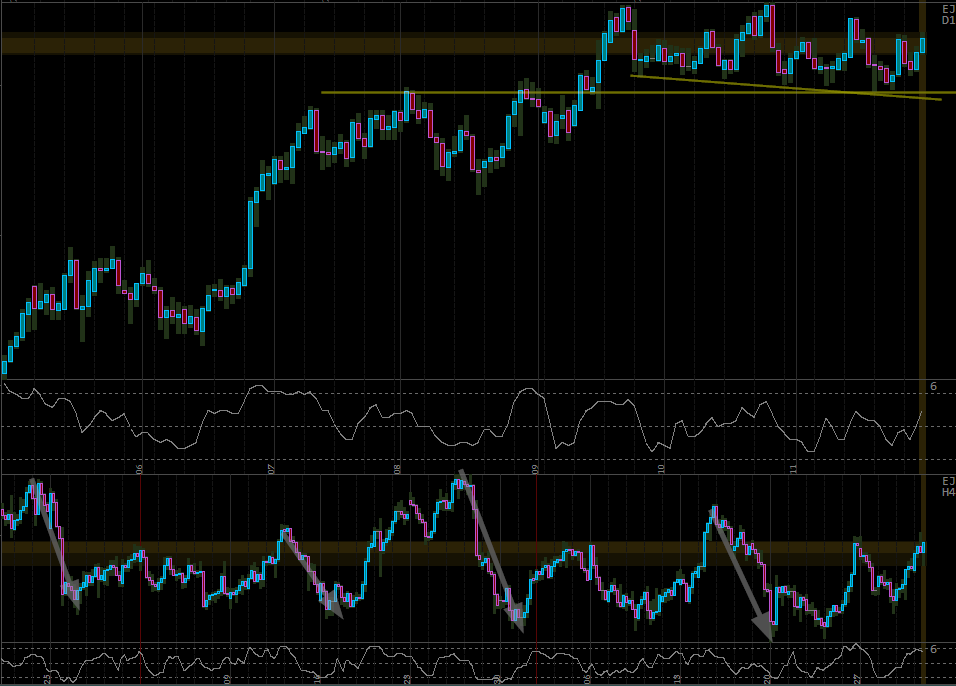
Yet another EUR pair which may offer a Selling opportunity very soon. Note strong Bearish waves (each making lower lows) any time Bulls are getting near the previous highs. As we are getting above the middle of this range, I am looking for any weakness/rejection as an excuse to establish a Short.


29th of November 2017

While trend is clearly Bullish on Daily, the prior Bearish wave on Weekly is still causing some concerns. Price is approaching an important resistance, and Bears showed some strength in the last 5 weeks, breaking Bullish TL.

As Price trades near the recent high, I am watching for a potential breakout failure.

Recent Bullish strength on UC is caused by CAD, while USD is only trying to recover from the drop the last week. I still note that current Bearish wave on CAD is much slower than the preceding Bullish.

Weak Bullish correction on H4 is starting to show signs supply coming on the Market. The whole Bearish move is still not comparing favorably to the prior Bullish wave, but seems to be accelerating in the last 3 weeks.

This correction might extend higher to the green line, without changing the trend, and since the logical place for SL is above that line, the price is still too low to Sell.

Fading the trend – what could be more exciting? This is one of these situation when I really want to Sell, for no other reason than the price being too high. But a trade like this takes some convincing, and Bears at least could have held the lower price as they broke below the short term range on H4. No, if that’s all they got, I’m not Selling – not just yet.

Bulls showing some strength, having broken Bearish TL, let’s see how long they can hold before Bears regroup. I am not eager to be buying yet – not after the recent Bearish wave on Daily. There is a resistance area to watch for just above the current price.

…And lower it goes. Buying looks increasingly less likely, and Selling on a weak pullback to the green support-turned-resistance increasingly more likely.

AH is slowing down its descent, but Bulls fail to reverse the price. I’ve been holding a Short for more than 6 weeks now, and not looking to cash out anytime soon – the break lower looks more likely than reversal. Given the huge range we’ve broke out from on Weekly I would rather expect to reach the low of the year in the next 2-3 months.

It never feels quite right to Sell so late in a long term Bearish trend, but the current correction provides a sufficient correction to justify the entry. Bulls are doing everything they can to bring the price higher from these levels, and yet they fail, again and again. Each subsequent push is reaching lower highs and shows weaker momentum.

While the current push looks quite strong on H4, it still failed as soon as it started approaching the high of the previous one.

28th of November 2017

GJ is slowly correcting lower, and as it breaks the recent low many stops will be triggered. Given the context of weak correction after an explosive Bullish move 2 months earlier, a rejection of this coming break is very likely. Note too that we are in a weak pullback after a strong break above major Weekly resistance – now support.

Any signs of rejection or weakness on the break in the next couple of days is an opportunity to Buy with expectation of Weekly trend continuation.

Individual currencies hardly need any comment, with GBP pushing for a break, while JPY correcting against a Bearish trend. JPY has a chance of reversing the trend in the next couple days and will need to show weakness right about now.

NU is trying to break now triple low on Weekly. There is a good chance it will fail, but the current correction is providing an acceptable price for a Sell entry, on any lower TF signs of weakness of the current Bullish wave.

This is an interesting level to watch on EC – multi year high where P has been rejected on several occasions already. Current Bullish trend is speeding up on Daily and a break is almost a certainly. The question is whether there will be a weak pullback following it, allowing for a Buy entry. The area of green line is a nice price to Buy, but it will be at least a couple more days before this opportunity can be confirmed.

This is very interesting – P rejected from the recent break above the 2 months long range. While Weekly trend remains Bullish, the 2 most recent swings on Daily indicate higher probability of Bearish PA in the short term. Looking for a small pullback to Sell, aiming at least for the first green support.

P continues pushing lower, but the current Bearish wave is much weaker, compared to the previous one. Expecting breakout failure.

Even though P is breaking below the recent range on Daily, Weekly still looks like a potential opportunity to Buy, provided P shows inability to go lower in the next couple days.